. 2000 Aug 1;97(16):9058-63.
doi: 10.1073/pnas.160068997.

Molecular basis of protein kinase C-induced activation of ATP-sensitive potassium channels

Affiliations

Molecular basis of protein kinase C-induced activation of ATP-sensitive potassium channels

P E Light et al. Proc Natl Acad Sci U S A. .

Abstract

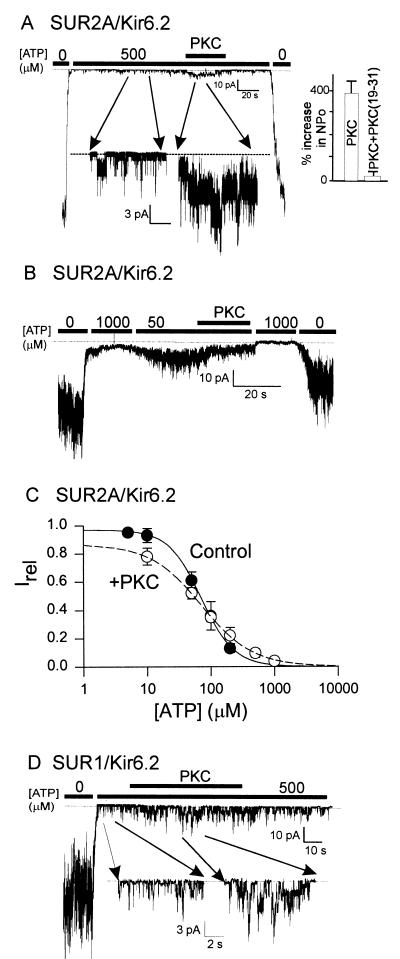
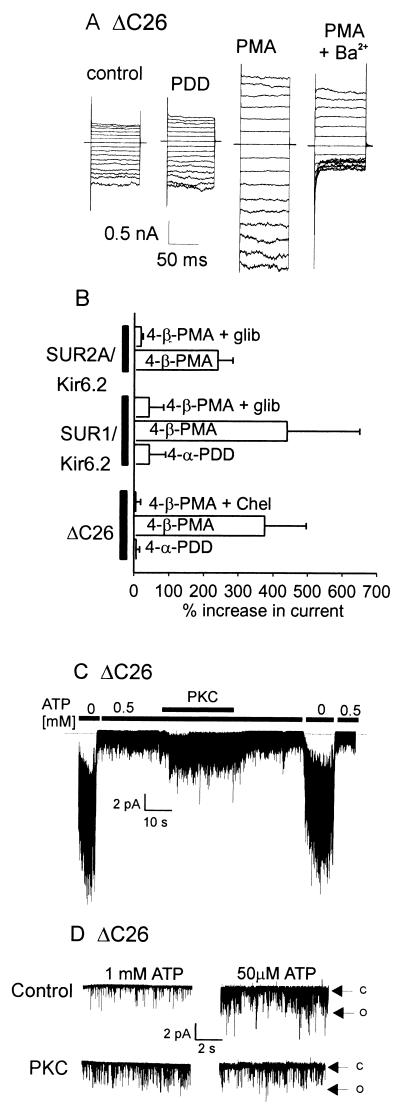
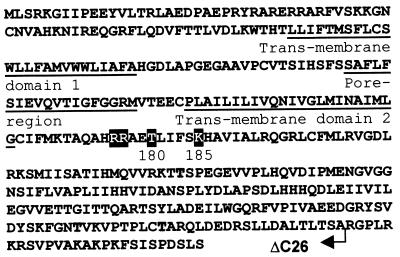
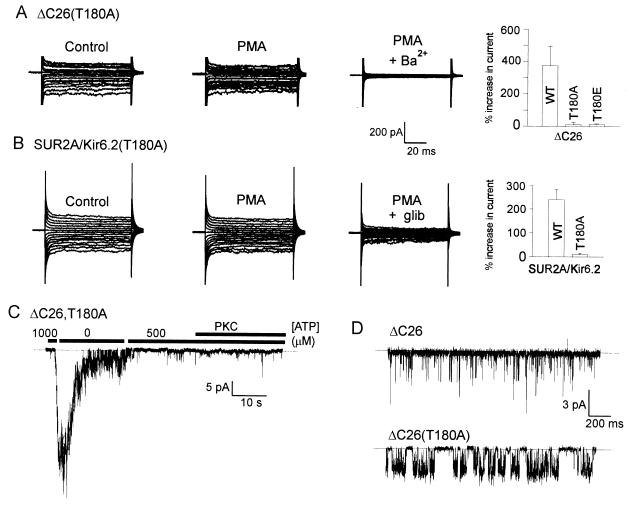
Potassium channels that are inhibited by internal ATP (K(ATP) channels) provide a critical link between metabolism and cellular excitability. Protein kinase C (PKC) acts on K(ATP) channels to regulate diverse cellular processes, including cardioprotection by ischemic preconditioning and pancreatic insulin secretion. PKC action decreases the Hill coefficient of ATP binding to cardiac K(ATP) channels, thereby increasing their open probability at physiological ATP concentrations. We show that PKC similarly regulates recombinant channels from both the pancreas and heart. Surprisingly, PKC acts via phosphorylation of a specific, conserved threonine residue (T180) in the pore-forming subunit (Kir6.2). Additional PKC consensus sites exist on both Kir and the larger sulfonylurea receptor (SUR) subunits. Nonetheless, T180 controls changes in open probability induced by direct PKC action either in the absence of, or in complex with, the accessory SUR1 (pancreatic) or SUR2A (cardiac) subunits. The high degree of conservation of this site among different K(ATP) channel isoforms suggests that this pathway may have wide significance for the physiological regulation of K(ATP) channels in various tissues and organelles.


Figures

Figure 1
Figure 1
PKC and mechanisms of action on the KATP channel. (A and B) Representative currents from an inside-out patch containing wild-type (WT) (SUR2A/Kir6.2) cardiac KATP channels. The patches were excised and held at −50 mV in symmetrical K+ (140 mM) and then exposed to different internal ATP concentrations. The addition of constitutively active PKC (20 nM) is indicated by the solid bar. (A) Note that PKC activates SUR2A/Kir6.2 channel activity in the presence of 500 μM ATP. Inset shows cumulative data from five patches (PKC) or three patches [PKC(19–31)]. The PKC inhibitor peptide PKC(19–31) was used at a concentration of 5 μM. (B) Note that PKC inhibits SUR2A/Kir6.2 channel activity at low (50-μM) levels of ATP. (C) Estimates of IC50 were obtained by grouping data from between four and seven patches, at each ATP concentration, in the absence (●) or presence (○) of PKC. Data were fitted to the equation Irel = 1/{1 + ([ATP]/IC50)n}, where Irel is the current relative to the maximal current observed in the absence of ATP and n is the Hill coefficient. IC50 values of 70 μM and 71 μM were determined in the absence and presence of PKC, respectively. (D) Representative WT (SUR1/Kir6.2) pancreatic beta cell KATP channel current response to PKC from an inside-out patch under the same conditions as in A.
Figure 2
Figure 2
PKC activates KATP channels in the presence and absence of the SUR subunit. (A) Representative whole-cell current recordings from a tsA201 cell expressing the Kir6.2 ΔC26 truncation mutant by using the nystatin-perforated patch technique (20). Recordings were made 6 min after the application of either the inactive phorbol analog (PDD, 100 nM) or the active phorbol ester PMA (100 nM). Block by external barium (2 mM) was used to indicate KATP current amplitude. (B) Cumulative data from whole-cell current experiments using ΔC26 alone, SUR1/Kir6.2, or SUR2A/Kir6.2 (n = 4–8 cells for each group). (C) Recording from an inside-out patch containing multiple ΔC26 channels that shows an increase in activity on application of constitutively active PKC (20 nM). (D) Inside-out patch recordings from ΔC26 channels showing the effects of constitutively active PKC on channel activity at an internal [ATP] of either 1 mM or 50 μM. Note that PKC activates ΔC26 in the presence of high (1 mM) ATP but inhibits ΔC26 activity at low (50 μM) ATP. Holding potential in both C and D was −50 mV using symmetrical, 140 mM K+. C and O indicate closed and open levels, respectively.
Figure 3
Figure 3
Amino acid sequence of the rabbit heart Kir6.2 subunit. T180, situated within the best consensus site for PKC phosphorylation, is highlighted white on black. Other potential PKC phosphorylation sites are shaded. The position of the ΔC26 truncation is denoted by the arrow.
Figure 4
Figure 4
Phorbol ester (PMA) does not increase currents in cells expressing KATP channels with the T180A Kir6.2 mutation. (A) Representative whole-cell current recordings of ΔC26(T180A) channel activity in response to 100 nM PMA (6 min) by using the nystatin-perforated patch technique. (B) Whole-cell perforated patch current recording from a cell coexpressing SUR2A and a full length Kir6.2(T180A) mutant showing the effect of 100 nM PMA (6 min). The histograms represent cumulative data from between four and six cells; wild-type (WT) data are replotted from Fig. 2B for comparison. (C) Representative inside-out patch recording of ΔC26(T180A) channel activity showing the response to ATP and constitutively active PKC. No effect of PKC on ΔC26(T180A) channels was observed in any of three patches tested. (D) Representative inside-out patch, single-channel recordings from ΔC26 and ΔC26(T180A) channels. Longer open times than for the wild-type ΔC26 were observed in each of three patches containing the ΔC26(T180A) mutant channel. Recordings were made in the absence of ATP at a holding potential of −50 mV in symmetrical, 140 mM K+.
Figure 5
Figure 5
Autoradiographic analysis of PKC-mediated phosphorylation of the KATP channel. (A) Autoradiograph showing an assay of PKC-catalyzed phosphorylation of the band corresponding to antibody-purified ΔC26/FLAG proteins with either threonine (T) or alanine (A) at position 180 (lanes 1 and 2). Phosphorylation of membrane proteins from tsA201 cells expressing either ΔC26/FLAG or ΔC26(T180A)/FLAG was performed by using [γ-32P]ATP as the phosphate donor. The PKC concentration in the reaction mixture was 250 nM. For the indicated bands, the PKC inhibitor PKC(19–31) (500 nM) or chelerythrine (5 μM) was added to the phosphorylation reaction mixture before the addition of PKC. Under these conditions, the specific inhibitor peptide PKC(19–31) (lanes 3 and 4) caused a significant reduction in phosphorylation (see Materials and Methods, Phosphorylation Assays section) whereas chelerythrine (lanes 5 and 6) almost completely prevented PKC-catalyzed phosphorylation. (B) Corresponding Western blot of the same protein samples as in A, indicating comparable levels of ΔC26/FLAG protein in all lanes.

References

    1. Seino S. Annu Rev Physiol. 1999;61:337–362. - PubMed
    1. Babenko A P, Aguilar-Bryan L, Bryan J. Annu Rev Physiol. 1998;60:667–687. - PubMed
    1. Aguilar-Bryan L, Bryan J. Endocr Rev. 1999;20:101–135. - PubMed
    1. Inagaki N, Gonoi T, Clement J P, IV, Namba N, Inazawa J, Gonzalez G, Aguilar Bryan L, Seino S, Bryan J. Science. 1995;270:1166–1170. - PubMed
    1. Inagaki N, Gonoi T, Clement J P, IV, Wang C-Z, Aguilar-Bryan L, Bryan J, Seino S. Neuron. 1996;16:1011–1017. - PubMed

Publication types

Substances

LinkOut - more resources