. 2000 Aug;182(16):4414-24.
doi: 10.1128/JB.182.16.4414-4424.2000.

Characterization of LrpC DNA-binding properties and regulation of Bacillus subtilis lrpC gene expression

Affiliations

Characterization of LrpC DNA-binding properties and regulation of Bacillus subtilis lrpC gene expression

C Beloin et al. J Bacteriol. 2000 Aug.

Abstract

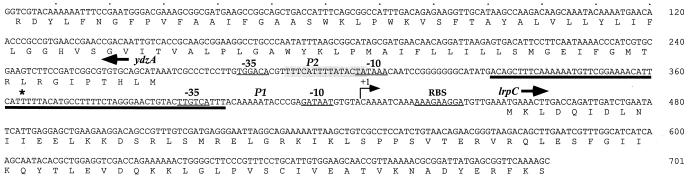
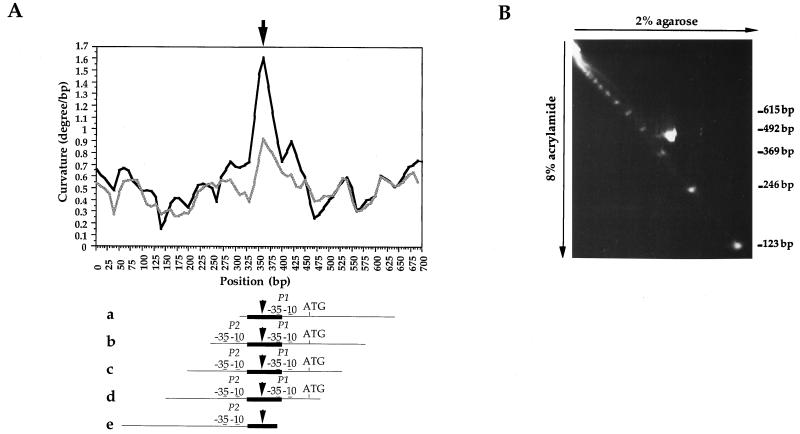
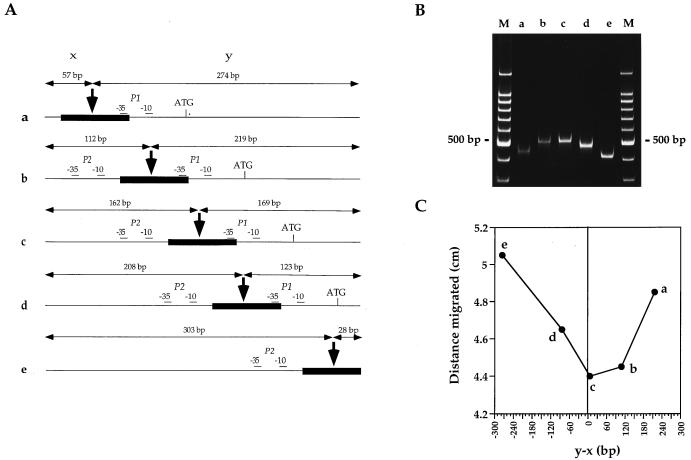
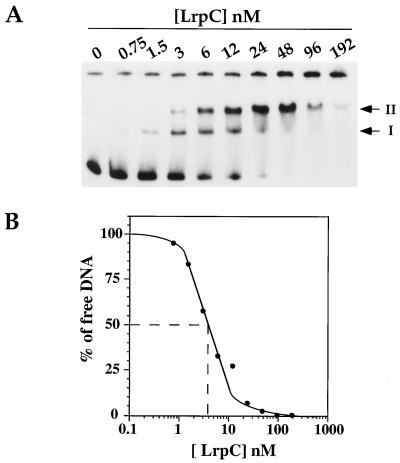
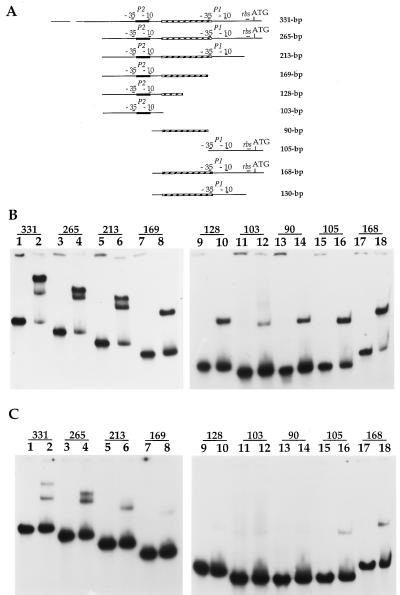
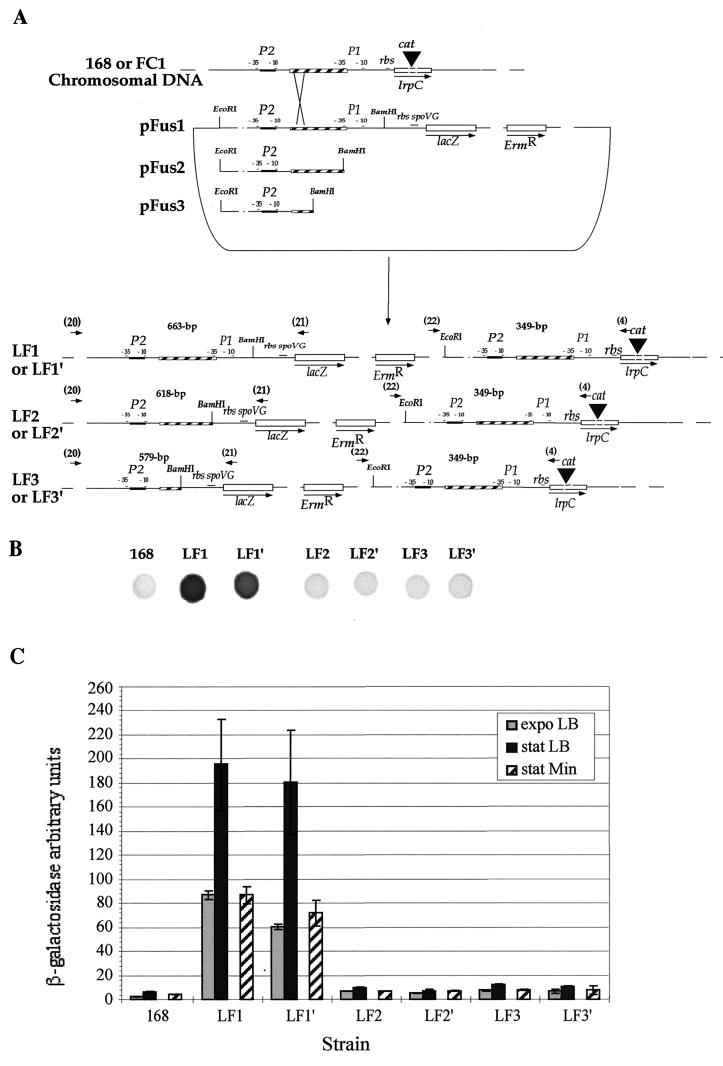
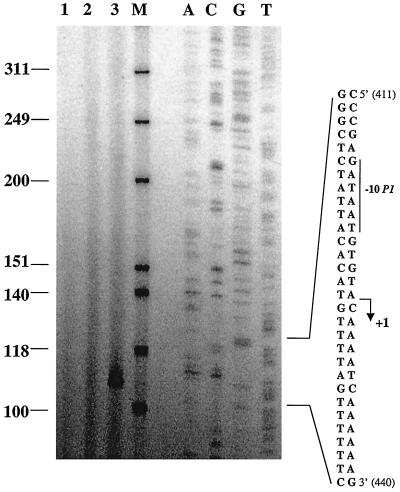
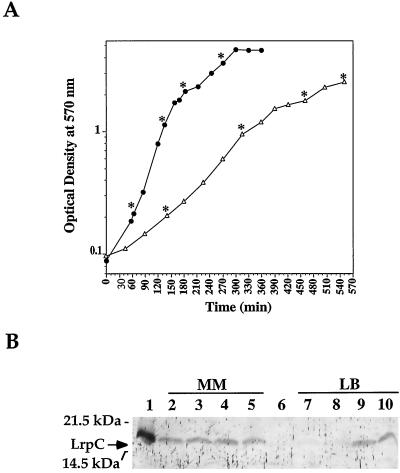
The lrpC gene was identified during the Bacillus subtilis genome sequencing project. Previous experiments suggested that LrpC has a role in sporulation and in the regulation of amino acid metabolism and that it shares features with Escherichia coli Lrp, a transcription regulator (C. Beloin, S. Ayora, R. Exley, L. Hirschbein, N. Ogasawara, Y. Kasahara, J. C. Alonso, and F. Le Hégarat, Mol. Gen. Genet. 256:63-71, 1997). To characterize the interactions of LrpC with DNA, the protein was overproduced and purified. We show that LrpC binds to multiple sites in the upstream region of its own gene with a stronger affinity for a region encompassing P1, one of the putative promoters identified (P1 and P2). By analyzing lrpC-lacZ transcriptional fusions, we demonstrated that P1 is the major in vivo promoter and that, unlike many members of the lrp/asnC family, lrpC is not negatively autoregulated but rather slightly positively autoregulated. Production of LrpC in vivo is low in both rich and minimal media (50 to 300 LrpC molecules per cell). In rich medium, the cellular LrpC content is six- to sevenfold lower during the exponentional phase than during the stationary growth phase. Possible determinants and the biological significance of the regulation of lrpC expression are discussed.


Figures

FIG. 1
FIG. 1
Relevant nucleotide sequence of the lrpC 5′ noncoding region. The nucleotide sequence of a 700-bp fragment containing the whole lrpC 5′ noncoding region is presented. Putative transcriptional and translational signals are underlined. The 15-bp sequence containing 12 bp matching the E. coli Lrp consensus binding site is shaded. The transcription start site of P1 (+1), determined by primer extension (see Fig. 7), is represented by a black arrow. The intrinsically bent segment localized between promoters P1 and P2 is thickly underlined. The center of the curvature is indicated by the asterisk. The gene ydzA, whose function is unknown, and which is located 185 bp upstream of lrpC, is also indicated, as well as the first 90 amino acids it encodes. It is transcribed in the opposite direction with respect to lrpC.
FIG. 2
FIG. 2
Detection of lrpC 5′ noncoding region curvature. (A) Computer analysis of the curvature of the lrpC 5′ noncoding region. The 700-bp sequence presented in Fig. 1 was subjected to the DNA ReSCue program (21). Two curves, determined as described by Koo and Crothers (18) (black) and Bolshoy et al. (4) (grey), are presented. Curvature (degrees per base pair) is plotted against position in the sequence. Maximum curvature is indicated by the arrow. The permuted fragments used in the curvature assay (see Fig. 3) are aligned under the 700-bp sequence curvature graph. (B) 2D electrophoresis of a 331-bp fragment (amplified with primers 3 and 4 and corresponding to fragment d in the curvature assay) containing the lrpC promoter region. The 331-bp fragment and the 123-bp linear DNA ladder (Gibco BRL) were separated in the first dimension in a 2% agarose gel and in the second dimension in an 8% polyacrylamide gel at 4°C. DNA was stained by incubating the gel with ethidium bromide at 0.2 μg/ml.
FIG. 3
FIG. 3
Localization of the maximum curvature of the lrpC 5′ noncoding region. (A) Five different ∼331-bp fragments (a to e) of the lrpC 5′ noncoding region were PCR amplified. The positions of the start and end points of the fragments with respect to the sequence given in Fig. 1 are as follows: a, 302 to 633; b, 251 to 582; c, 202 to 531; d, 157 to 488; e, 63 to 392. The maximum curvature predicted by in silico analysis (thick arrow) was displaced along the ∼331-bp fragments. x and y represent the distances, in base pairs, of this putative curvature maximum from the 5′ and 3′ extremities of the fragment, respectively. P1, P2, and ATG of lrpC are indicated. (B) The five ∼331-bp fragments were run on a 6% polyacrylamide gel at 4°C. Lanes M represent linear 100-bp DNA ladders (Promega). (C) For each fragment, the distance migrated (centimeters) was plotted against the position of the predicted curvature maximum relative to the center of the fragment (y − x). Zero on the abscissa corresponds to the position of curvature maximum predicted by computer analysis.
FIG. 4
FIG. 4
Binding of LrpC to its own promoter region. (A) The 5′ lrpC region (0.5 nM, 331 bp) corresponding to fragment d (Fig. 3A) was 32P end labeled and mixed with increasing LrpC concentrations ranging from 0 to 192 nM (calculated on the basis of the tetramer form of the protein) in a 20-μl final volume. Complexes were resolved on a 6% polyacrylamide gel. The gel was dried, bands were visualized by autoradiography, and each band was quantitated with a PhosphorImager (Molecular Dynamics). The positions of complexes I and II are indicated. (B) Binding isotherm of free DNA (percent) at various LrpC concentrations. The Kapp value was estimated as the LrpC concentration required for 50% saturation of the 331-bp DNA promoter region.
FIG. 5
FIG. 5
Binding of LrpC to different segments of the lrpC 5′ noncoding region. (A) Ten fragments containing different parts of the 5′ lrpC promoter region were generated by PCR (see Materials and Methods). Each fragment was identified by its size in base pairs. Each 32P-end-labeled fragment (0.5 nM) was mixed with LrpC (12 nM) in a 20-μl final volume and in the presence of a 250-fold excess in mass of synthetic competitor S15-12 DNA (0.15 μM). Complexes were formed under two saline conditions, in 50 mM NaCl (B) and in 150 mM NaCl (C), to discriminate between high- and low-affinity LrpC binding. Complexes were resolved in a 6% polyacrylamide gel. The gel was dried, and bands were visualized by autoradiography and quantitated with a PhosphorImager (Molecular Dynamics). Percentages of bound DNA in 50 and 150 mM NaCl, respectively, were as follows: 331-bp fragment, 84.6 and 23.7%; 265-bp fragment, 77.5 and 46%; 213-bp fragment, 70.4 and 18.3%; 169-bp fragment, 47 and 6.8%; 128-bp fragment, 36.4 and 4.9%; 103-bp fragment, 14 and 4.9%; 90-bp fragment, 19.8 and 3.5%; 105-bp fragment, 50.5 and 11.7%; 168-bp fragment, 76.7 and 18.4%.
FIG. 6
FIG. 6
Construction and activities of various lrpC-lacZ fusions. (A) Three fragments encompassing different parts of the 5′ lrpC region were cloned upstream of the lacZ gene in plasmid pFus (this work) and sequenced to verify their integrity. The 15-bp sequence matching the E. coli Lrp consensus binding site is in the black box, whereas the curved DNA region is in the hatched box. Integrations were then performed by single crossover in the lrpC locus in a wild-type (168 leading to LF1 to LF3) or mutant (FC1 leading to LF1′ to LF3′) lrpC genetic context. Plasmid DNA is included between the EcoRI and BamHI restriction sites. Ermr recombinant strains were used for further analysis. The lacZ gene is controlled by the P1-P2 region in LF1 and LF1′ and by the P2 region in LF2 and LF2′ (with the whole curved DNA region) and in LF3 and LF3′ (with the first third of the curved DNA region). In LF1, LF2, and LF3, the wild-type lrpC gene is under the control of the entire P1-P2 region. Oligonucleotides used for junction verification and predicted sizes of the corresponding PCR fragments are indicated. rbs, ribosome-binding site. (B) β-Galactosidase activity of the lrpC-lacZ fusions on solid medium. Approximately 2 · 106 bacteria of each transformant type were placed on a petri dish of glucose minimal Spizizen medium (see Materials and Methods) with ERM at 5 μg/ml and X-Gal at 100 μg/ml. Incubation was performed for 16 h at 37°C and prolonged at room temperature (25°C) until sufficient blue coloration appeared. (C) β-Galactosidase activity of the lrpC-lacZ fusions in liquid medium. The different strains were grown in glucose minimal Spizizen and LB media, and the expression of lrpC was monitored using the sensitive liquid Galacto-Light Assay protocol (Tropix). Relative luminescence units were then converted to β-galactosidase units using a standard curve. Arbitrary β-galactosidase units correspond to (β-galactosidase units per minute per milliliter per unit of OD600) × 10−6.
FIG. 7
FIG. 7
Analysis of lrpC promoters by primer extension. Primer extension of in vivo-produced lrpC mRNA. Total RNAs from B. subtilis strains 168pHP13 and 168pHP13lrpC were used as templates for primer extension with 32P-end-labeled primer 23. RNA was prepared from exponential-phase (OD600 of 1.0) cells. Lanes: 1, control (without RNA); 2, strain 168pHP13; 3, strain 168pHP13lrpC; M, markers (Promega); 1 to 3, reaction at 90°C for 1 min, 55°C for 10 min, 0°C for 15 min, and extension at 42°C for 1 h; 4 to 8, control sequence performed with plasmid pT712lrpC as the template and the same 5′-end 32P-labeled oligonucleotide primer used for primer extension. The sequence read (corresponding to positions 411 to 440 in Fig. 1) and that of the complementary strand are presented. The +1 and −10 sequences of promoter P1 are indicated. The values to the left are molecular sizes (in bases).
FIG. 8
FIG. 8
Production of lrpC in rich and minimal media during growth. (A) B. subtilis strain 168 was grown in both rich LB medium (●) and glucose minimal supplemented Spizizen medium (MM; ▵) (see Materials and Methods). At different times of growth, indicated by asterisks, cell concentrations were determined and crude protein extracts were prepared. (B) A 12-μg sample of each extract was then subjected to LrpC immunodetection. Lanes: 1, 2.5 ng of pure LrpC protein; 2 to 5, extracts from glucose minimal medium, (OD600, 0.2, 0.95, 1.78, and 2.52); 6, protein extract from FC1 (lrpC mutant) strain; 7 to 10, extracts from LB medium (OD600, 0.22, 1.13, 2.10, and 3.60).

References

    1. Altschul S F, Gish W, Miller W, Myers E W, Lipman D J. Basic local alignment search tool. J Mol Biol. 1990;215:403–410. - PubMed
    1. Belitsky B R, Gustafsson M C U, Sonenshein A L, Von Wachenfeldt C. An lrp-like gene of Bacillus subtilis involved in branched-chain amino acid transport. J Bacteriol. 1997;179:5448–5457. - PMC - PubMed
    1. Beloin C, Ayora S, Exley R, Hirschbein L, Ogasawara N, Kasahara Y, Alonso J C, Le Hégarat F. Characterization of an lrp-like (lrpC) gene from Bacillus subtilis. Mol Gen Genet. 1997;256:63–71. - PubMed
    1. Bolshoy A, McNamara P, Harrington R E, Trifonov E N. Curved DNA without A-A: experimental estimation of all 16 DNA wedge angles. Proc Natl Acad Sci USA. 1991;88:2312–2316. - PMC - PubMed
    1. Brennan R G, Matthews B W. The helix-turn-helix DNA binding motif. J Biol Chem. 1989;264:1903–1906. - PubMed

Publication types

MeSH terms

LinkOut - more resources