. 2000 Aug;66(8):3574-85.
doi: 10.1128/AEM.66.8.3574-3585.2000.

Spatial and temporal variations in chitinolytic gene expression and bacterial biomass production during chitin degradation

Affiliations

Spatial and temporal variations in chitinolytic gene expression and bacterial biomass production during chitin degradation

A M Baty 3rd et al. Appl Environ Microbiol. 2000 Aug.

Abstract

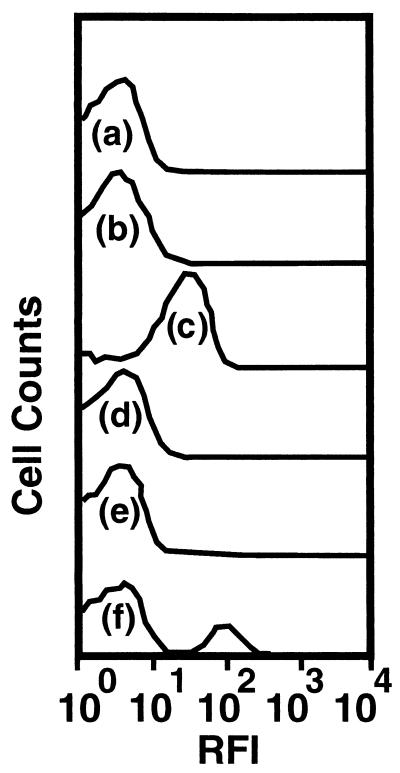
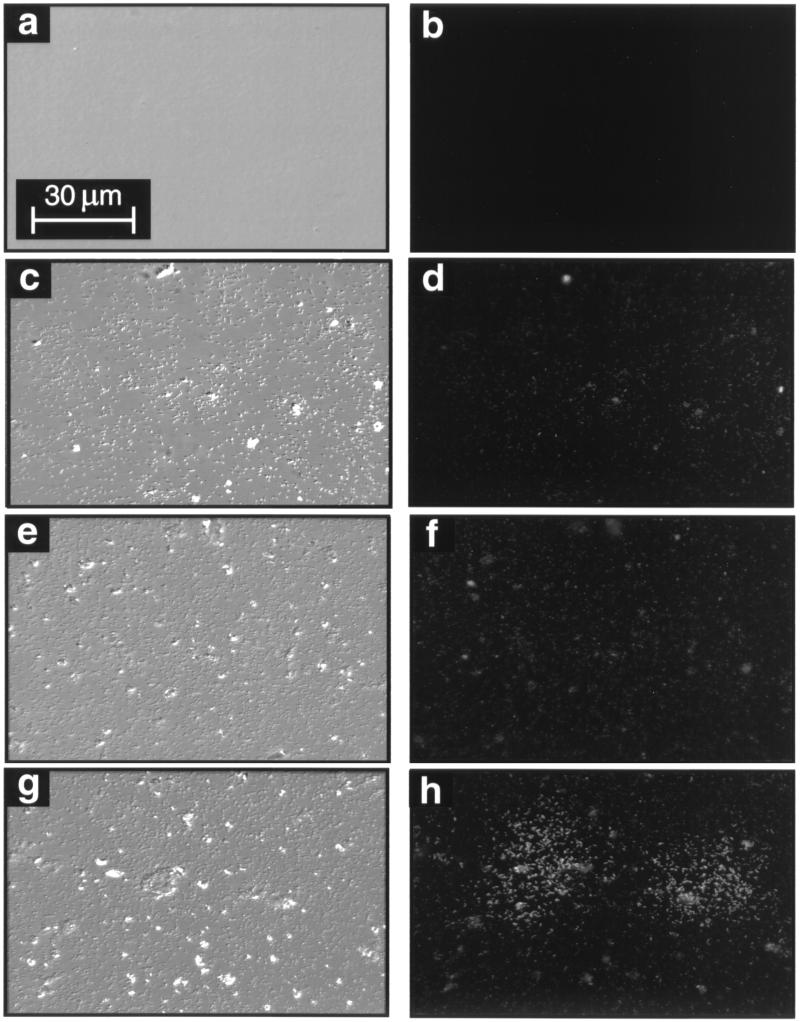
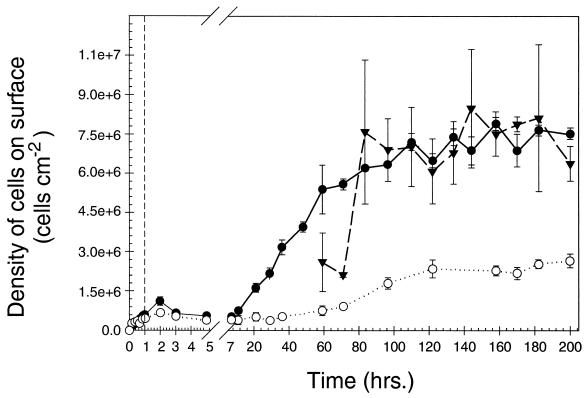
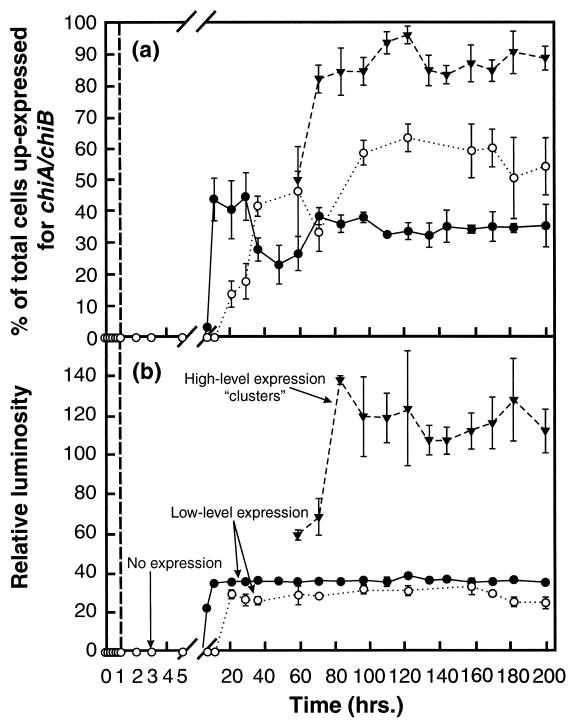
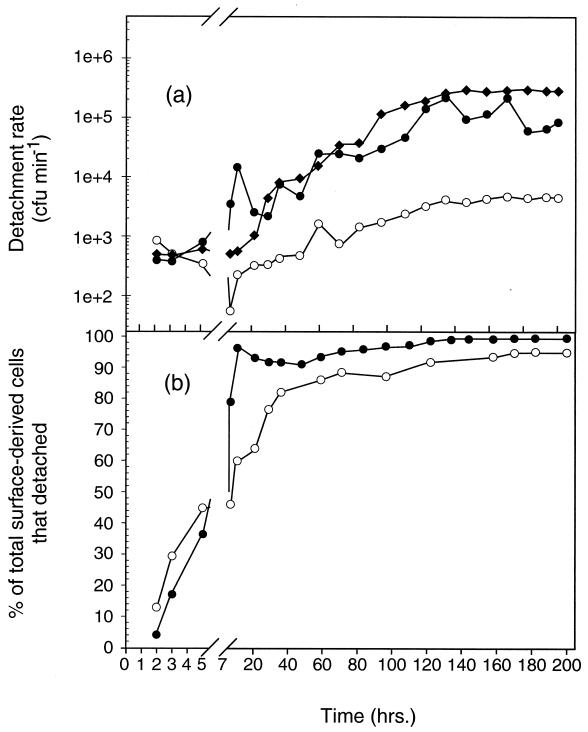
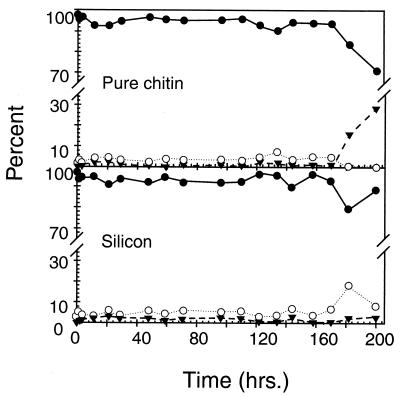
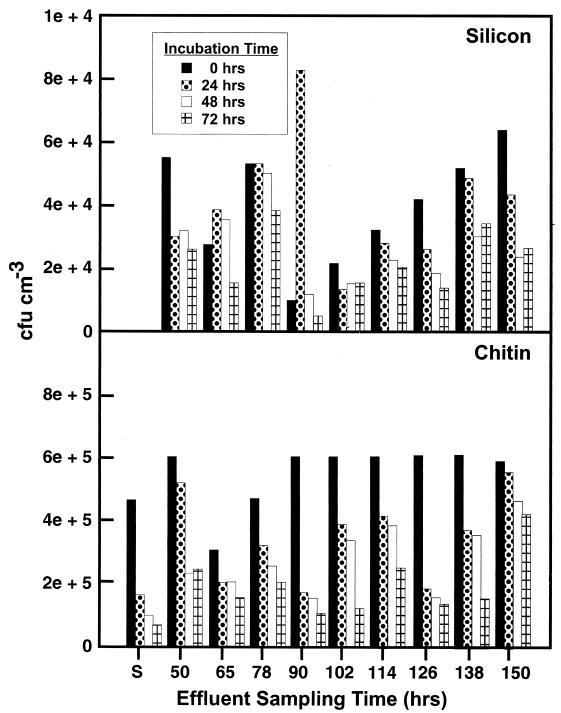
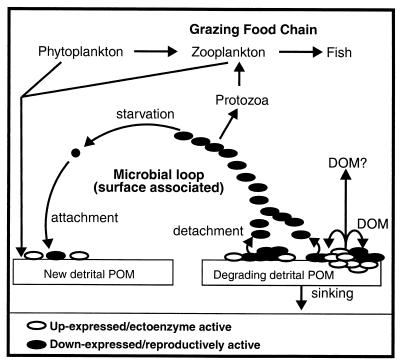
Growth of the chitin-degrading marine bacterium S91 on solid surfaces under oligotrophic conditions was accompanied by the displacement of a large fraction of the surface-derived bacterial production into the flowing bulk aqueous phase, irrespective of the value of the surface as a nutrient source. Over a 200-h period of surface colonization, 97 and 75% of the bacterial biomass generated on biodegradable chitin and a nonnutritional silicon surface, respectively, detached to become part of the free-living population in the bulk aqueous phase. Specific surface-associated growth rates that included the cells that subsequently detached from the substrata varied depending on the nutritional value of the substratum and during the period of surface colonization. Specific growth rates of 3.79 and 2.83 day(-1) were obtained when cells first began to proliferate on a pure chitin film and a silicon surface, respectively. Later, when cell densities on the surface and detached cells as CFU in the bulk aqueous phase achieved a quasi-steady state, specific growth rates decreased to 1.08 and 0.79 day(-1) on the chitin and silicon surfaces, respectively. Virtually all of the cells that detached from either the chitin or the silicon surfaces and the majority of cells associated with the chitin surface over the 200-h period of surface colonization displayed no detectable expression of the chitin-degrading genes chiA and chiB. Cells displaying high levels of chiA-chiB expression were detected only on the chitin surface and then only clustered in discrete areas of the surface. Surface-associated, differential gene expression and displacement of bacterial production from surfaces represent adaptations at the population level that promote efficient utilization of limited resources and dispersal of progeny to maximize access to new sources of energy and maintenance of the population.


Figures

FIG. 1
FIG. 1
Histograms of RFI from GFP reporting expression of chiA-chiB genes in a population of S91 cells starved for 400 h in defined seawater solution (a), growing as a batch culture in defined seawater solution supplemented with glutamate (b), growing as a batch culture in defined seawater solution supplemented with GlcNAc (c), recovered in the effluent from the LFC containing silicon surfaces 96.5 h postinoculation (d), recovered in the effluent from the LFC containing pure chitin surfaces 96.5 h postinoculation (e), and recovered in the effluent from the LFC containing pure chitin surfaces 200 h postinoculation (f). Each histogram is based on evaluation of 5 × 10⁵ cells.
FIG. 2
FIG. 2
DIC (left panels) and epifluorescence (right panels) photomicrographs of clean, sterile chitin thin film surface (a and b), silicon surface 96.5 h postinoculation (c and d), pure chitin surface 96.5 h postinoculation (e and f), and pure chitin surface 200 h postinoculation (g and h).
FIG. 3
FIG. 3
Total cell densities on silicon surface (○), in areas of a pure chitin surface lacking clusters of cells displaying high-level chiA-chiB expression (●), and in areas of a pure chitin surface within clusters of cells displaying high-level chiA-chiB expression (▾) following inoculation of LFCs with starved-cell suspension (vertical dashed line). Vertical solid bars represent 1 standard deviation around the mean (n = 6 for each data point).
FIG. 4
FIG. 4
(a) Percentage of total surface-associated cells up-expressed for chiA-chiB on a silicon surface (○) and on the pure chitin surface in areas outside clusters of cells displaying high-level expression (●) and within clusters of cells displaying high-level expression (▾). (b) Relative luminosity of cells displaying different levels of chiA-chiB gene expression. The vertical dashed line identifies the time at which the feed to the LFCs was switched from the starved-cell suspension to the sterile defined seawater solution. Vertical solid bars represent 1 standard deviation around the mean (n = 6 for each data point).
FIG. 5
FIG. 5
(a) Contribution of CFU in the LFC effluents by surface-derived cells that detached from the chitin (●), silicon (○), and natural squid pen chitin (⧫) surfaces. (b) Percentage of the total surface-derived population at different times of surface colonization that detached from the chitin (●) and silicon (○) surfaces.
FIG. 6
FIG. 6
Percentage of total cells that detached from the pure chitin (top) and silicon (bottom) surfaces that displayed no expression (●), 1 to 10 RFI units), low-level expression (○), 10 to 100 RFI units), and high-level expression (▾, 30 to 300 RFI units) of chiA-chiB genes.
FIG. 7
FIG. 7
CFU recovered from effluents of chitin- and silicon-containing LFCs at various times postinoculation after incubation as a batch culture at 20°C for 0, 24, 48, and 72 h. CFU recovered following exposure of a glutamate-grown culture of S91 to unsupplemented defined seawater solution for 0, 24, 48, and 72 h are presented for comparison (S).
FIG. 8
FIG. 8
Schematic representation of the pathway involved in the degradation of detrital POM and resulting production of surface-derived microbial biomass based on results obtained using a model system. Starved cells of Pseudoalteromonas sp. strain S91 attach to a surface and form two subpopulations: one whose chitin-degrading genes become up-expressed and another whose chitin-degrading genes remain down-expressed. The former, through chitinase production and excretion, supplies the latter with soluble chitin degradation products for bacterial production at the surface. Progeny detach from the surface and disseminate into the bulk aqueous phase to seek out new detrital POM to repeat the cycle.

References

    1. Alldredge A L, Gotschalk C. In situ settling behavior of marine snow. Limnol Oceanogr. 1988;33:339–351.
    1. Alldredge A L, Cole J J, Caron D A. Production of heterotrophic bacteria inhabiting macroscopic organic aggregates (marine snow) from surface waters. Limnol Oceanogr. 1986;31:68–78.
    1. Azam F. Microbial control of oceanic carbon flux: the plot thickens. Science. 1998;280:694–696.
    1. Azam F, Hodson R. Size distribution and activity of marine microheterotrophs. Limnol Oceanogr. 1977;22:492–501.
    1. Bae H, Hudson S M. The cooperative binding behavior of sodium dodecyl sulfate to crosslinked chitosan films. J Appl Polymer Sci: Part A Polymer Chem. 1997;35:3755–3765.

Publication types

LinkOut - more resources