. 2000 Aug;116(2):125-42.
doi: 10.1085/jgp.116.2.125.

A Cl(-) cotransporter selective for NH(4)(+) over K(+) in glial cells of bee retina

Affiliations

A Cl(-) cotransporter selective for NH(4)(+) over K(+) in glial cells of bee retina

P Marcaggi et al. J Gen Physiol. 2000 Aug.

Abstract

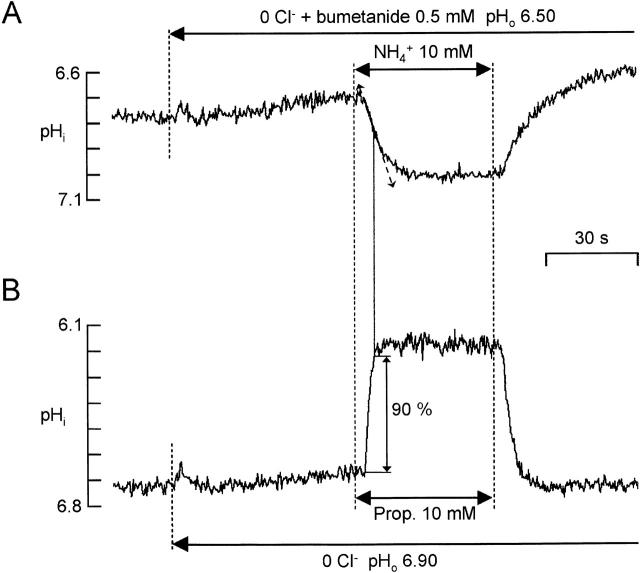
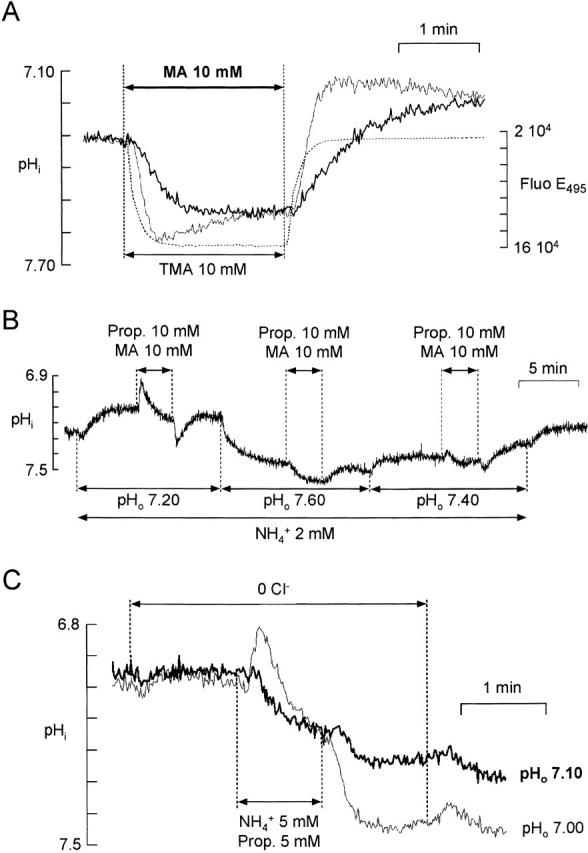
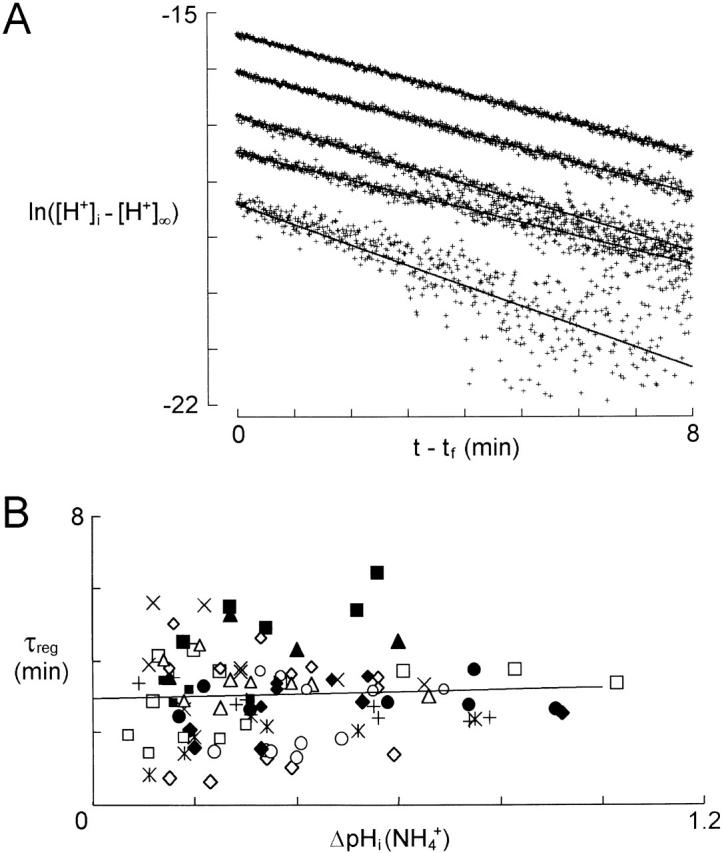
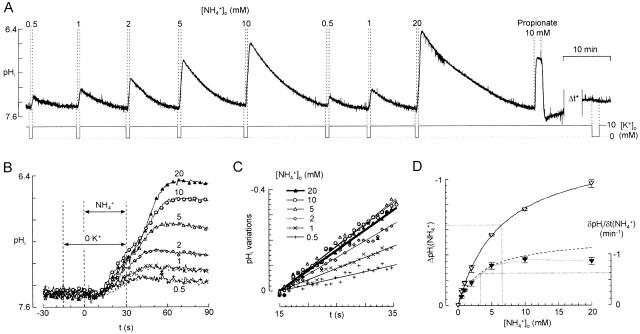
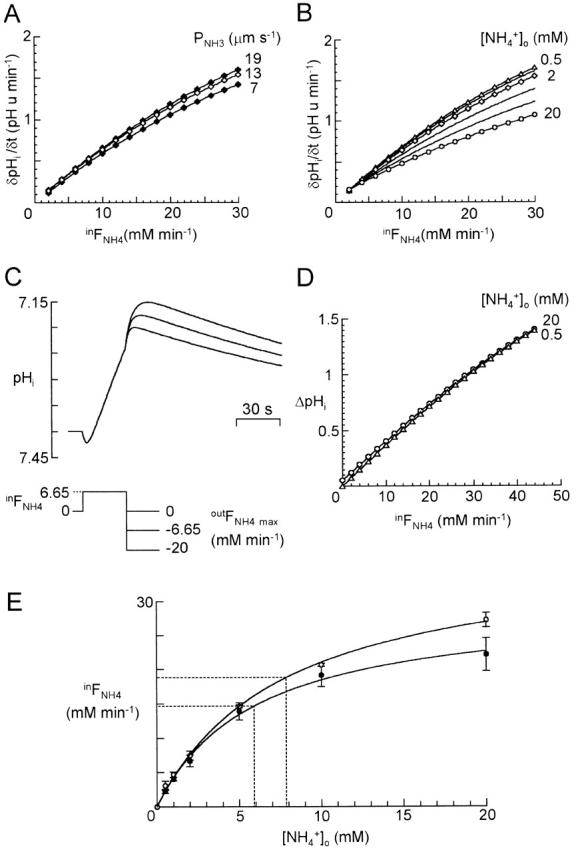
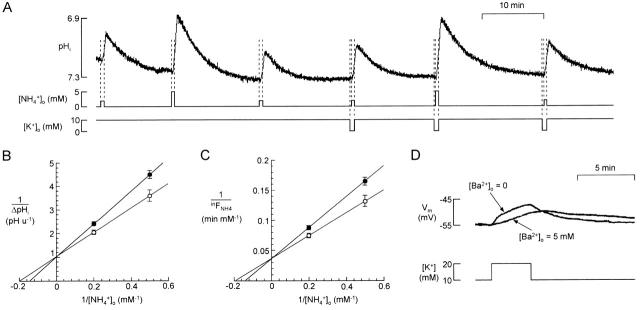
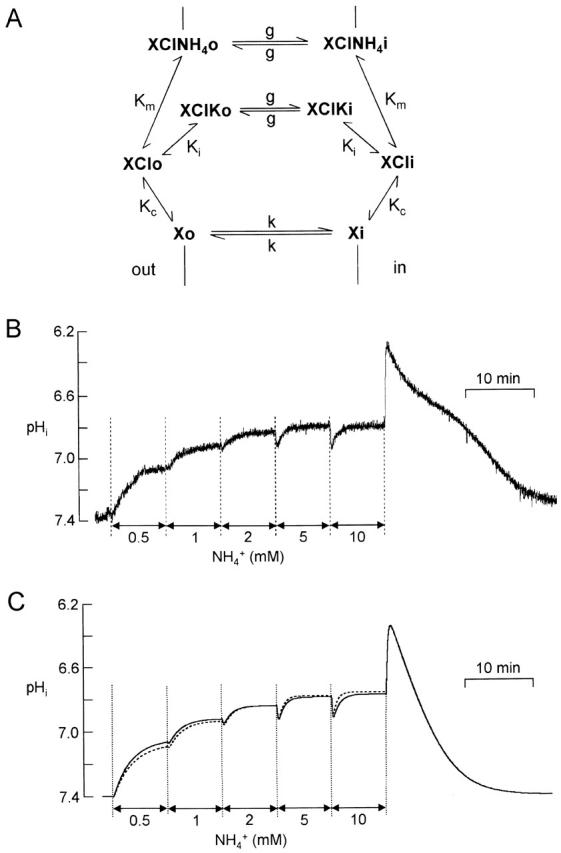
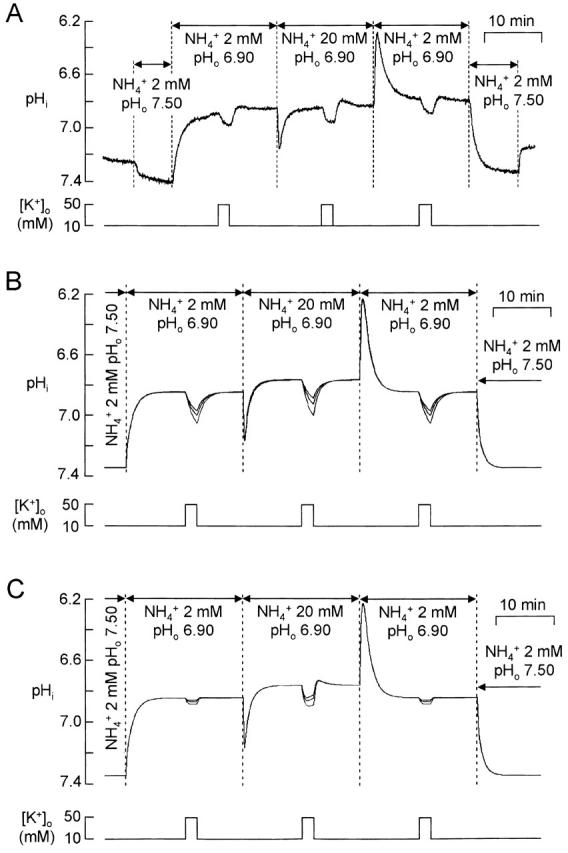
There appears to be a flux of ammonium (NH(4)(+)/NH(3)) from neurons to glial cells in most nervous tissues. In bee retinal glial cells, NH(4)(+)/NH(3) uptake is at least partly by chloride-dependant transport of the ionic form NH(4)(+). Transmembrane transport of NH(4)(+) has been described previously on transporters on which NH(4)(+) replaces K(+), or, more rarely, Na(+) or H(+), but no transport system in animal cells has been shown to be selective for NH(4)(+) over these other ions. To see if the NH(4)(+)-Cl(-) cotransporter on bee retinal glial cells is selective for NH(4)(+) over K(+) we measured ammonium-induced changes in intracellular pH (pH(i)) in isolated bundles of glial cells using a fluorescent indicator. These changes in pH(i) result from transmembrane fluxes not only of NH(4)(+), but also of NH(3). To estimate transmembrane fluxes of NH(4)(+), it was necessary to measure several parameters. Intracellular pH buffering power was found to be 12 mM. Regulatory mechanisms tended to restore intracellular [H(+)] after its displacement with a time constant of 3 min. Membrane permeability to NH(3) was 13 microm s(-1). A numerical model was used to deduce the NH(4)(+) flux through the transporter that would account for the pH(i) changes induced by a 30-s application of ammonium. This flux saturated with increasing [NH(4)(+)](o); the relation was fitted with a Michaelis-Menten equation with K(m) approximately 7 mM. The inhibition of NH(4)(+) flux by extracellular K(+) appeared to be competitive, with an apparent K(i) of approximately 15 mM. A simple standard model of the transport process satisfactorily described the pH(i) changes caused by various experimental manipulations when the transporter bound NH(4)(+) with greater affinity than K(+). We conclude that this transporter is functionally selective for NH(4)(+) over K(+) and that the transporter molecule probably has a greater affinity for NH(4)(+) than for K(+).


Figures

Figure 1
Figure 1
Speed of the solution changes. (A) The perfusion chamber. A channel was milled in a polymethacrylate slab and a glass cover slip was glued on the bottom. Note the rounded edges of the channel. (B) Speed of solution change. The data points show the change in fluorescence observed through the 40× microscope objective focused on cells on the floor of the chamber during a 120-s perfusion change from standard solution to one containing 1 μg liter−1 fluorescein. The time scale was displaced so that zero coincides with the beginning of the fluorescence change. The solid lines represent the best fits of data points obtained by regressions with simple exponentials {1 − exp(−t1) and exp[−(t − 120)/τ2]} whose time constants, τ1 and τ2, are given in the figure.
Figure 2
Figure 2
Effect of extracellular ammonium application on pHi of an isolated bundle of glial cells. (A) The ammonium-induced acidification was slightly inhibited by K+ or Rb+. For each application of 2 mM NH4 +, [K+]o was either maintained at its baseline value of 10 mM, changed as indicated, or replaced by 50 mM Rb+. (B) The response to a 5-min application of 2 mM NH4 + can be divided into five phases, which correspond to different patterns of fluxes (C). This cell had a fairly acid baseline pHi (≈7.17) so that Phase 1 was prominent. (C) Schemes of fluxes corresponding to four of the phases indicated in B. (Phase 1) Inward flux of NH3 is greater than ∼1% of inward flux of NH4 +. The maintenance of intracellular equilibrium NH4 + ↔ NH3 + H+ consumes H+ ions. (Phase 2) NH4 + transmembrane gradient is still inward, while [NH3]i slightly exceeds [NH3]o. H+ ions are shuttled into the cell. (Phase 3) Extrusion of H+ ions by pH regulatory mechanisms equals inward flux of NH4 +. (Phase 4) This phase is approximately the inverse of Phase 1. Phase 5 (not shown) consists almost entirely of H+ efflux. (D) Scheme of transmembrane fluxes during ammonium exposure. pHi changes result from three transmembrane fluxes, FNH4, FNH3, and net H+ flux through pH regulatory processes (Freg) (see text).
Figure 2
Figure 2
Effect of extracellular ammonium application on pHi of an isolated bundle of glial cells. (A) The ammonium-induced acidification was slightly inhibited by K+ or Rb+. For each application of 2 mM NH4 +, [K+]o was either maintained at its baseline value of 10 mM, changed as indicated, or replaced by 50 mM Rb+. (B) The response to a 5-min application of 2 mM NH4 + can be divided into five phases, which correspond to different patterns of fluxes (C). This cell had a fairly acid baseline pHi (≈7.17) so that Phase 1 was prominent. (C) Schemes of fluxes corresponding to four of the phases indicated in B. (Phase 1) Inward flux of NH3 is greater than ∼1% of inward flux of NH4 +. The maintenance of intracellular equilibrium NH4 + ↔ NH3 + H+ consumes H+ ions. (Phase 2) NH4 + transmembrane gradient is still inward, while [NH3]i slightly exceeds [NH3]o. H+ ions are shuttled into the cell. (Phase 3) Extrusion of H+ ions by pH regulatory mechanisms equals inward flux of NH4 +. (Phase 4) This phase is approximately the inverse of Phase 1. Phase 5 (not shown) consists almost entirely of H+ efflux. (D) Scheme of transmembrane fluxes during ammonium exposure. pHi changes result from three transmembrane fluxes, FNH4, FNH3, and net H+ flux through pH regulatory processes (Freg) (see text).
Figure 3
Figure 3
Absolute measurement of pHi during application of 2 mM NH4 +. (A) Recording of BCECF fluorescence ratio from a bundle of glial cells. Different mixtures of propionate (Prop) and trimethylamine (TMA) were applied during prolonged application of 2 mM ammonium, first with pHo = 6.90, and then with pHo = 7.30. (B) In experiments like that of A, pHi was calculated from responses to application of two mixtures of propionate and TMA and ascribed to the time midway between the two applications (e.g., arrows in A and B correspond to the same point). The data points shown are for an ammonium concentration of 2 mM and the solid line is a linear regression through them. The dashed line simply illustrates that the mean initial pHi was 7.3. (C) Summary of results for the pHi measured ∼10 min after application of 2 mM ammonium at pH 6.90. The results for different pairs of weak acids and weak bases are shown separately; for the pair propionate/TMA, a possible dependence on pHi was examined by comparing the mean values for cells with an initial baseline pHi < 7.10 (“acid”) and those with baseline pHi > 7.10 (“alkaline”). Bars show SDs. (D) Absolute pHi reached during 2 mM NH4 + application at pHos 6.50 (n = 7), 6.90 (n = 6), 7.30 (n = 6), and 7.70 (n = 7). The solid line is a linear regression through the data points (R = 0.996), vertical bars represent ±SD, horizontal bars represent the precision of the adjusted pHo of the solutions. (E) Recording showing pHi reached in nigericin 10 μM pHo 6.90 compared with pHi reached in NH4 + 2 mM pHo 6.90.
Figure 4
Figure 4
Direct measurement of PNH3. (A) A bundle of cells was held with a pipette ∼50 μm above the floor of the chamber and perifused for 30 min in pHo 6.20 to reduce pHi. The cells were then perifused with 0 Cl solution containing bumetanide 500 μM for 1 min before 10 mM NH4 + o was substituted for Na+ o. (B) A few minutes after the response of A, the same bundle attached to the pipette was perifused with 10 mM propionate in the same conditions. The propionate-induced pHi change gave a lower limit for the speed of the change in solution at the cell membrane.
Figure 5
Figure 5
Indirect measurement of NH3 permeability. (A) Direct measurement of PMA. The pHi change induced by 10 mM methylamine (MA) (thick line) was compared with that induced by 10 mM trimethylamine (TMA) (thin line) and to the change in fluorescence on switching to a solution containing 1μg liter−1 fluorescein (dotted line). The microscope was focused on the same bundle for the three recordings. (B) Relative cell membrane permeabilities to neutral forms of propionate (Prop) and MA. A bundle of cells was superfused with 2 mM NH4 + so that pHi was maintained at a value close to pHo (Fig. 3 D). When 10 mM Prop + 10 mM MA was applied at pHo 7.2, entry of the neutral form of Prop initially predominated, but as [Prop]i increased, entry of MA began to predominate and pHi started to increase. The initial change in pHi reversed for a value of pHo between 7.40 and 7.60. (C) Relative cell membrane permeabilities to NH3 and to the neutral form of Prop. A mixture of 5 mM NH4 + and 5 mM Prop was applied to cells superfused with a 0 Cl solution at pHo 7.10 (thick trace) or 7.00 (thin trace). The two recordings were from the same bundle of cells. At pHo 7.10, the initial change in pHi was an increase, while at pHo 7.00 it was a decrease.
Figure 6
Figure 6
pHi recovery from ammonium-induced acid loads. (A) Analysis of recoveries from acidifications induced by applications of 0.5, 1, 2, 5, and 10 mM NH4 + on the same bundle of glial cells. ln([H+]i − [H+]) was plotted against tt f, where t f is 45 s after the end of the NH4 + superfusion. From linear regressions of the data points, τreg was calculated as being (min): 2.74 (correlation coefficient, R = 0.761), 3.96 (R = 0.971), 3.29 (R = 0.978), 3.68 (R = 0.996), and 3.75 (R = 0.998) for the recoveries from the increasing acidifications induced by 0.5, 1, 2, 5, and 10 mM NH4 +. (B) τreg, calculated as in A, as a function of ΔpHi at the beginning of the recovery. The data are from 17 cell bundles (each represented by a different symbol) for which at least three different [NH4 +]o were applied. For each cell bundle, a linear regression was calculated and a line with the mean of their slopes [(0.3 min (pH unit )−1] is shown passing through the barycenter of the points.
Figure 7
Figure 7
pHi changes as a function of ammonium concentration (for 30-s applications in 0 K+). (A) Typical recording of pHi responses to various NH4 + concentrations. Cells were normally superfused with 10 mM K+ standard solution that was switched to a 0 K+ solution 15 s before each NH4 + application. The response to 10 mM propionate (near the end of the experiment) gives a lower limit for the rapidity of the solution changes. On the same cells, after a delay of ≈20 min (“Δt*”), removal of extracellular K+ with no ammonium application had no detectable effect on pHi. (B) Superposition of pHi responses to NH4 + (from A) on a shorter time scale. Dotted lines for 0.5 and 1 mM NH4 + are the second (control) responses. The delay between activation of the solenoid valve (t = 0) and the start of the changes in pHi was ∼10 s. Note that during the NH4 + application, pHi fell more rapidly for 10 mM NH4 + than for 20 mM, but that the peak reached after the application (Phase 4) was greater for 20 mM. (C) Calculation of δpHit(NH4 +) for each NH4 +-induced acidification. Mean slopes were measured between 15 and 35 s after the onset of the NH4 + application by linear regression. Taking into account the delay for arrival of solutions, this interval corresponds to the last 20 s of the NH4 + applications. (D) Mean values for ΔpHi([NH4 +]o) (peak change in pHi, open symbols) and δpHit([NH4 +]o) (filled symbols) from four experiments similar to that of A. Bars represent ± SEM. The best Michaelis-Menten fits of ΔpHi([NH4 +]o) for [NH4 +]o = 0.5, 1, 2, 5, 10, and 20 mM (solid line) and of δpHit([NH4 +]o) for [NH4 +]o = 0.5, 1, 2, and 5 mM (dotted line) are shown.
Figure 8
Figure 8
Use of the cell model (Fig. 2 D) to derive inward FNH4([NH4 +]o) from measured pHi changes induced by brief applications of NH4 +. (A) Constant inward FNH4 (inFNH4) was imposed on the model for 30 s. δpHit, calculated 15 s after onset, was plotted against inFNH4. Data are shown for simulations with [NH4 +]o set to 2 mM (to fix [NH3]o) and PNH3 = 7, 13, and 19 μm s−1. (B) As in A, δpHit was plotted versus inFNH4 for simulations with [NH4 +]o = 0.5 mM (triangles), 1 and 2 mM (diamonds), and 5, 10, and 20 mM (circles). PNH3 = 13 μm s−1. Because increasing [NH4 +]o increases [NH3]o, δpHit(inFNH4) is smaller for higher [NH4 +]o. (C) Simulations in which an inFNH4 was imposed for 30 s and followed by an outward FNH4 (outFNH4). inFNH4 was set to 6.65 mM min−1 and [NH3]o was fixed by setting [NH4 +]o = 2 mM; this gave δpHit = 0.44 pH unit min−1, equal to the mean measured pHi change induced by 2 mM NH4 + in 0 K+ for cells with baseline pHi ≈ 7.4. At t = 30 s, FNH4 switched instantaneously from inFNH4 to maximum outFNH4, outFNH4 max, and decreased to zero as [NH4 +]i decreased to zero (see text). Simulations for outFNH4 max equal to 0, −6.65, and −20 mM min−1 show that the rebound acidification after 30 s decreased when outFNH4 max increased. (D) Plot of ΔpHi(inFNH4) measured as baseline pHi (7.4) minus the minimal pHi reached during the rebound acidification after 30 s of influx inFNH4. Simulations for 0.5 mM (triangles) or 20 mM (circles) NH4 + o (+NH3o) show that [NH3]o has little effect on ΔpHi(inFNH4). outFNH4 max = 0. (E) inFNH4([NH4 +]o) calculated from δpHit([NH4 +]o) (•) and ΔpHi([NH4 +]o) (○) of Fig. 7 D. The points were fitted by Michaelis-Menten curves (R = 0.963 and 0.994, respectively) with apparent constants Km equal to 5.9 ± 1.3 and 7.8 ± 0.7 mM.
Figure 9
Figure 9
Inhibition of inward NH4 + flux by external K+. (A) Comparison of responses to 2 and 5 mM NH4 + in 0 and 10 mM K+. For each response, NH4 + was applied for 30 s; when applied in 0 K+, K+ was removed from the superfusate 15 s earlier. (B) Double inverse plot of mean ΔpHi vs. [NH4 +]o (n = 6). Straight lines passing through mean data points intersect the abscissa at [NH4 +]o = 5.02 mM (0 K+, ○) and 6.90 mM (10 mM K+, •). (C) Double inverse plot of inFNH4 vs. [NH4 +]o. inFNH4 is the mean value during the NH4 + application calculated from ΔpHi of the six experiments of B using the relation of Fig. 8 E. Straight lines passing through mean data points intersect the abscissa for [NH4 +]o = 5.16 mM (0 K+, ○) and 7.09 mM (10 mM K+, •). (D) Intracellular recording from a retinal slice with a microelectrode in the glial compartment. Increasing [K+] from 10 to 20 mM in the superfusate induced a depolarization of the cell membranes. When the same increase of [K+] was made after superfusing the slice with 5 mM barium for a few minutes, the depolarization was undetectable for at least the first 45 s.
Figure 10
Figure 10
pHi responses to stepwise increases in [NH4 +]o are accounted for by a model of the transport process. (A) Kinetic scheme of the cotransport of Cl and NH4 + or K+. The unloaded transporter molecule is symbolized by X; o or i indicate the position of the transporter at the external or internal side of the cell membrane. Binding ions Cl, NH4 +, and K+ are not shown in this scheme for visual simplicity. The three binding constants K c, K m, and K i for Cl, NH4 +, and K+ are unaffected by the side to which the transporter faces. Two kinetic constants, k and g, describe the transit steps of the unloaded and loaded transporter. (B) Experimental response to stepwise increases in [NH4 +]o. (C) Simulated response of the cell model of Fig. 2 D including the transporter model of A to stepwise increases in [NH4 +]o with affinity for NH4 +, K m = 5 mM (continuous line) and 20 mM (dashed line). K i was 15 mM.
Figure 11
Figure 11
Effects of increasing [K+]o from 10 to 50 mM on the plateau phase pHi during superfusion with 2 mM or 20 mM NH4 +. (A) Typical recording. At the beginning and end of the experiment, the cells were superfused with 2 mM NH4 + at pHo 7.50 to provide a pHi calibration (see Fig. 3 D). (B) Simulated effect of increasing [K+]o. In the model, [K+]i was kept constant when [K+]o was increased. The cell model included the transporter of Fig. 10 A (see online supplemental material for full list of parameter values). K m was 7 mM and K i was 10, 15, or 20 mM (superposed traces), the greatest inhibition being for K i = 10 mM. (C) Simulation with the model modified so that transport of NH4 + was inhibited by extracellular K+ in a noncompetitive manner. The transporter of Fig. 10 A was modified by removing the effect of increasing [K+]o on the binding step XClo → XClKo (this modification amounts to suppressing this binding step with no modification of the other parameters) and by the addition of an inhibitory step XClNH4o → XClNH4Ko, whose affinity constant for K+ o, K K, was 5, 10, or 15 mM (superposed traces), the greatest inhibition being for K K = 5 mM.

References

    1. Abramowitz M., Stegun I.A. Handbook of Mathematical Functions 1965. Dover Publications Inc; New York, NY: pp. 1046 pp
    1. Antonenko Y.N., Pohl P., Denisov G.A. Permeation of ammonia across bilayer lipid membranes studied by ammonium ion selective microelectrodes. Biophys. J. 1997;72:2187–2195. - PMC - PubMed
    1. Benjamin A.M., Quastel J.H. Metabolism of amino acids and ammonia in rat brain cortex slices in vitroa possible role of ammonia in brain function. J. Neurochem. 1975;25:197–206. - PubMed
    1. Bertrand, D. 1974. Etude des propriétés électrophysiologiques des cellules pigmentaires de la rétine du faux-bourdon (Apis mellifera). Thesis No. 1650. Université de Genéve.
    1. Boron W.F., De Weer P. Intracellular pH transients in squid axons caused by CO2, NH3, and metabolic inhibitors. J. Gen. Physiol. 1976;67:91–112. - PMC - PubMed

Publication types