

GIGANTEA is a nuclear protein involved in phytochrome signaling in Arabidopsis
- PMID: 10920210
- PMCID: PMC16943
- DOI: 10.1073/pnas.170283997
GIGANTEA is a nuclear protein involved in phytochrome signaling in Arabidopsis
Abstract
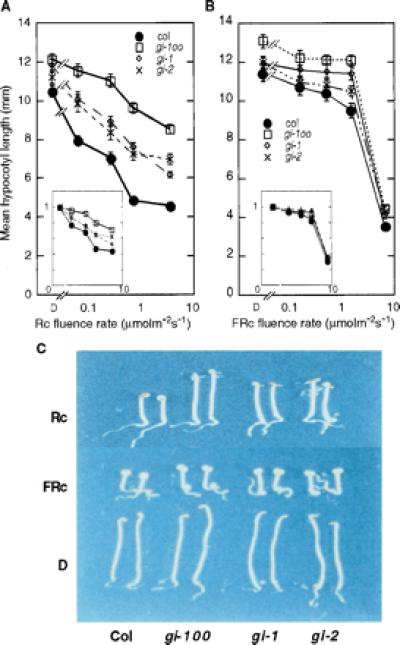
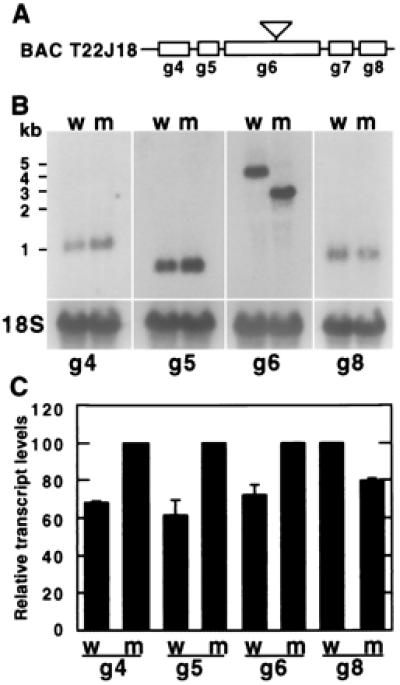
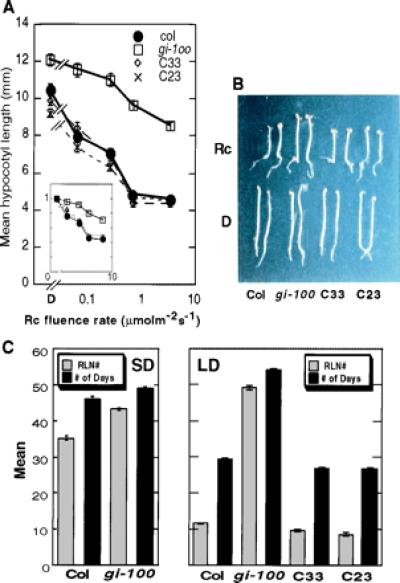
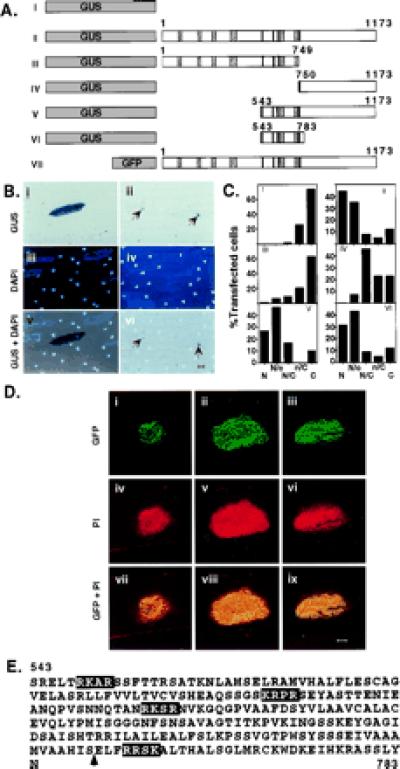
In a genetic screen of available T-DNA-mutagenized Arabidopsis populations for loci potentially involved in phytochrome (phy) signaling, we identified a mutant that displayed reduced seedling deetiolation under continuous red light, but little if any change in responsiveness to continuous far-red light. This behavior suggests disruption of phyB, but not phyA signaling. We have cloned the mutant locus by using the T-DNA insertion and found that the disrupted gene is identical to the recently described GIGANTEA (GI) gene identified as being involved in control of flowering time. The encoded GI polypeptide has no sequence similarity to any known proteins in the database. However, by using beta-glucuronidase-GI and green fluorescent protein-GI fusion constructs, we have shown that GI is constitutively targeted to the nucleus in transient transfection assays. Optical sectioning by using the green fluorescent protein-GI fusion protein showed green fluorescence throughout the nucleoplasm. Thus, contrary to previous computer-based predictions that GI would be an integral plasma membrane-localized polypeptide, the data here indicate that it is a nucleoplasmically localized protein. This result is consistent with the proposed role in phyB signaling, given recent evidence that early phy signaling events are nuclear localized.
Figures
Similar articles
-
The FAR1 locus encodes a novel nuclear protein specific to phytochrome A signaling.Genes Dev. 1999 Aug 1;13(15):2017-27. doi: 10.1101/gad.13.15.2017. Genes Dev. 1999. PMID: 10444599 Free PMC article.
-
Arabidopsis PSEUDO-RESPONSE REGULATOR7 is a signaling intermediate in phytochrome-regulated seedling deetiolation and phasing of the circadian clock.Plant Cell. 2003 Nov;15(11):2654-65. doi: 10.1105/tpc.015065. Epub 2003 Oct 16. Plant Cell. 2003. PMID: 14563930 Free PMC article.
-
HFR1 encodes an atypical bHLH protein that acts in phytochrome A signal transduction.Genes Dev. 2000 Sep 15;14(18):2377-91. Genes Dev. 2000. PMID: 10995393 Free PMC article.
-
RED AND FAR-RED INSENSITIVE 2, a RING-domain zinc finger protein, mediates phytochrome-controlled seedling deetiolation responses.Plant Physiol. 2006 Feb;140(2):457-65. doi: 10.1104/pp.105.073163. Epub 2005 Dec 29. Plant Physiol. 2006. PMID: 16384903 Free PMC article.
-
Photomophogenesis: Phytochrome takes a partner!Curr Biol. 1999 Mar 25;9(6):R225-7. doi: 10.1016/s0960-9822(99)80135-3. Curr Biol. 1999. PMID: 10209091 Review.
Cited by
-
ELF4 regulates GIGANTEA chromatin access through subnuclear sequestration.Cell Rep. 2013 Mar 28;3(3):671-7. doi: 10.1016/j.celrep.2013.02.021. Epub 2013 Mar 21. Cell Rep. 2013. PMID: 23523352 Free PMC article.
-
Expression conservation within the circadian clock of a monocot: natural variation at barley Ppd-H1 affects circadian expression of flowering time genes, but not clock orthologs.BMC Plant Biol. 2012 Jun 21;12:97. doi: 10.1186/1471-2229-12-97. BMC Plant Biol. 2012. PMID: 22720803 Free PMC article.
-
Post-Translational Mechanisms of Plant Circadian Regulation.Genes (Basel). 2021 Feb 24;12(3):325. doi: 10.3390/genes12030325. Genes (Basel). 2021. PMID: 33668215 Free PMC article. Review.
-
Shade signals alter the expression of circadian clock genes in newly-formed bioenergy sorghum internodes.Plant Direct. 2020 Jun 25;4(6):e00235. doi: 10.1002/pld3.235. eCollection 2020 Jun. Plant Direct. 2020. PMID: 32607464 Free PMC article.
-
Arabidopsis transcriptome profiling indicates that multiple regulatory pathways are activated during cold acclimation in addition to the CBF cold response pathway.Plant Cell. 2002 Aug;14(8):1675-90. doi: 10.1105/tpc.003483. Plant Cell. 2002. PMID: 12172015 Free PMC article.
References
-
- Kendrick R E, Kronenberg G H M. Photomorphogenesis in Plants. 2nd Ed. Dordrecht, The Netherlands: Kluwer; 1994.
-
- Sharrock R A, Quail P H. Genes Dev. 1989;3:1745–1757. - PubMed
-
- Clack T, Mathews S, Sharrock R A. Plant Mol Biol. 1994;25:413–426. - PubMed
-
- Quail P H, Boylan M T, Parks B M, Short T W, Xu Y, Wagner D. Science. 1995;268:675–680. - PubMed
-
- Ni M, Tepperman J M, Quail P H. Nature (London) 1999;390:781–784. - PubMed
Publication types
MeSH terms
Substances
LinkOut - more resources
Full Text Sources
Other Literature Sources
Molecular Biology Databases
