. 2000 Aug 1;14(15):1872-85.

Sip2p and its partner snf1p kinase affect aging in S. cerevisiae

Affiliations

Sip2p and its partner snf1p kinase affect aging in S. cerevisiae

K Ashrafi et al. Genes Dev. .

Abstract

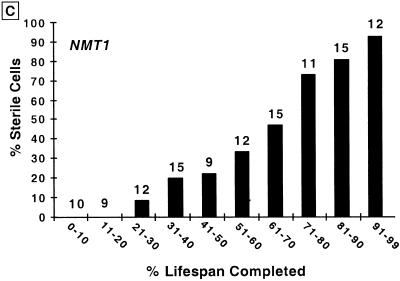
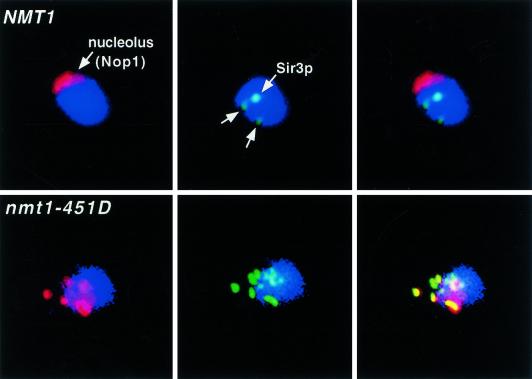
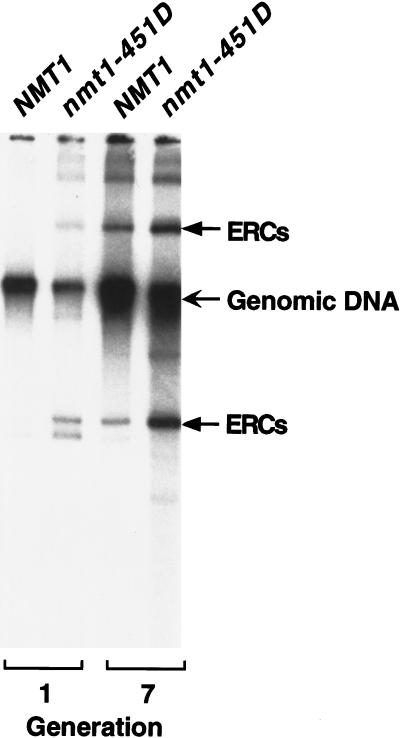
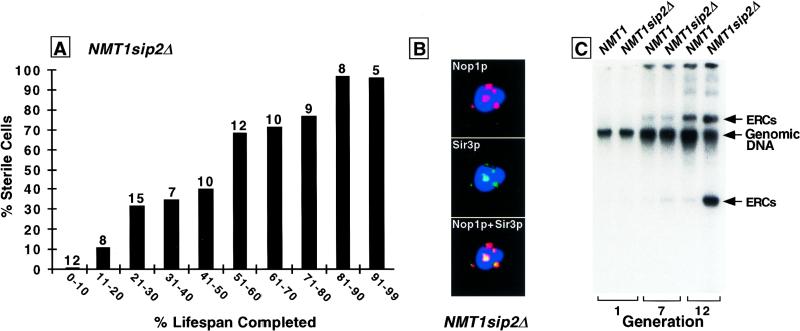
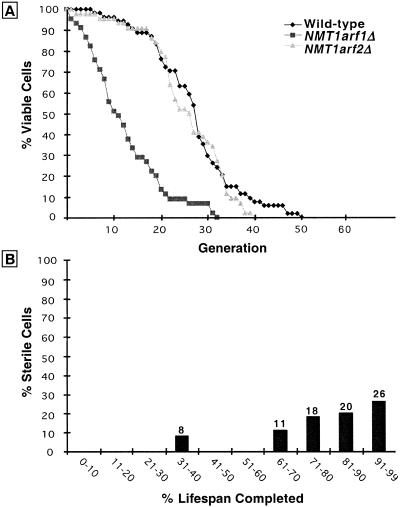
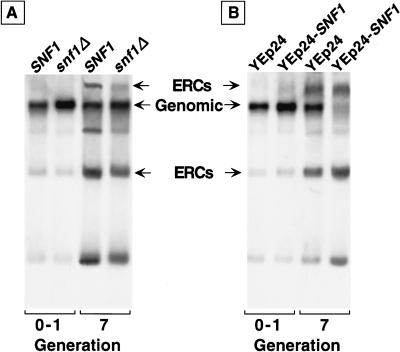
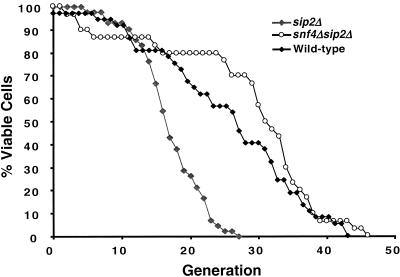
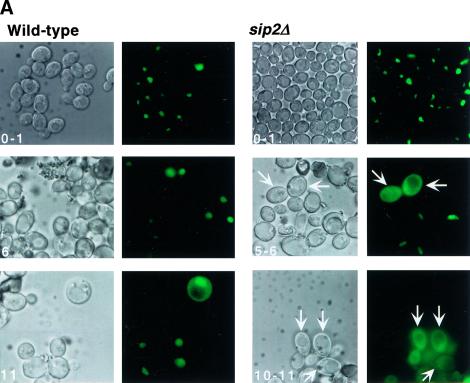
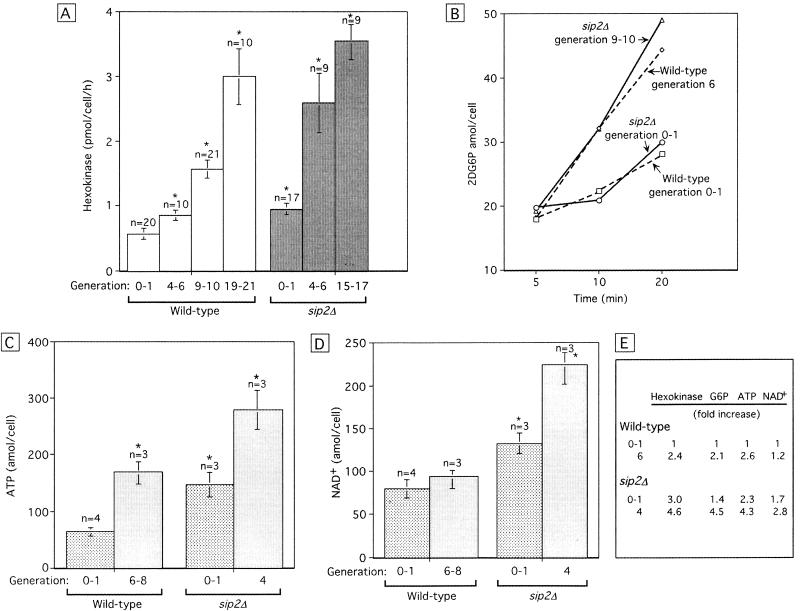
For a number of organisms, the ability to withstand periods of nutrient deprivation correlates directly with lifespan. However, the underlying molecular mechanisms are poorly understood. We show that deletion of the N-myristoylprotein, Sip2p, reduces resistance to nutrient deprivation and shortens lifespan in Saccharomyces cerevisiae. This reduced lifespan is due to accelerated aging, as defined by loss of silencing from telomeres and mating loci, nucleolar fragmentation, and accumulation of extrachromosomal rDNA. Genetic studies indicate that sip2Delta produces its effect on aging by increasing the activity of Snf1p, a serine/threonine kinase involved in regulating global cellular responses to glucose starvation. Biochemical analyses reveal that as yeast age, hexokinase activity increases as does cellular ATP and NAD(+) content. The change in glucose metabolism represents a new correlate of aging in yeast and occurs to a greater degree, and at earlier generational ages in sip2Delta cells. Sip2p and Snf1p provide new molecular links between the regulation of cellular energy utilization and aging.


Figures

Figure 1
Figure 1
The shortened lifespan of nmt1–451D cells is accompanied by progressive sterility. (A) Lifespans of isogenic NMT1 and nmt1–451D cells were determined by removing daughters from their mothers after each cell division and scoring the number of times each mother divides prior to senescence (n = 85 NMT1 mothers; 68 nmt1–451D mothers). Experiments were performed at 24°C. Mean lifespan is defined as the generation at which 50% of mothers are still dividing. The difference in mean lifespans of NMT1 and nmt1–451D mothers was statistically significant as judged by the nonparametric Wilcoxen signed rank test. (B) nmt1–451D cells become sterile during their short lifespan. Numbers that appear above each bar represent the number of cells whose pheromone response was scored at this point in their lifespan. At various generation times, individual MATa cells were moved near to a disk soaked in 0.25 μm α-factor. Four hours later they were scored for shmooing. They were then moved to an area of the YPD/agar plate away from the source of pheromone and allowed to complete their lifespan. nmt1–451D cells that have completed <50% of their lifespan are responsive to pheromone (i.e., they are fertile), while cells that have completed over 70% of their shortened lifespan are almost always sterile. (C) Parallel assays of sterility in the isogenic wild-type strain yield results equivalent to those obtained with the nmt1–451D strain: the percentage of sterile cells increases progressively as a function of the percentage of lifespan completed. Similar results were obtained when the wild-type strain was assayed at 24°C and at 30°C (data not shown).
Figure 1
Figure 1
The shortened lifespan of nmt1–451D cells is accompanied by progressive sterility. (A) Lifespans of isogenic NMT1 and nmt1–451D cells were determined by removing daughters from their mothers after each cell division and scoring the number of times each mother divides prior to senescence (n = 85 NMT1 mothers; 68 nmt1–451D mothers). Experiments were performed at 24°C. Mean lifespan is defined as the generation at which 50% of mothers are still dividing. The difference in mean lifespans of NMT1 and nmt1–451D mothers was statistically significant as judged by the nonparametric Wilcoxen signed rank test. (B) nmt1–451D cells become sterile during their short lifespan. Numbers that appear above each bar represent the number of cells whose pheromone response was scored at this point in their lifespan. At various generation times, individual MATa cells were moved near to a disk soaked in 0.25 μm α-factor. Four hours later they were scored for shmooing. They were then moved to an area of the YPD/agar plate away from the source of pheromone and allowed to complete their lifespan. nmt1–451D cells that have completed <50% of their lifespan are responsive to pheromone (i.e., they are fertile), while cells that have completed over 70% of their shortened lifespan are almost always sterile. (C) Parallel assays of sterility in the isogenic wild-type strain yield results equivalent to those obtained with the nmt1–451D strain: the percentage of sterile cells increases progressively as a function of the percentage of lifespan completed. Similar results were obtained when the wild-type strain was assayed at 24°C and at 30°C (data not shown).
Figure 2
Figure 2
Nucleolar fragmentation and Sir complex redistribution is observed in generation 7 nmt1–451D but not NMT1 cells. Multilabel immunofluorescence study. Fixed NMT1 cells [average bud scar count (ABSC) = 7.3 ± 3.3] and nmt1–451D cells (ABSC = 6.9 ± 2.0) are stained blue with 4′,6′-diamidino-2-phenylindole (DAPI) to visualize nuclear DNA. Nucleoli are marked with antibodies to yeast fibrillarin (Nop1p, red). Sir3p appears green. (Left panels) DAPI plus Nop1p; (middle panels) DAPI plus Sir3p; (right panels) DAPI, Nop1p, and Sir3p. The NMT1 cell has an intact, crescent-shaped nucleolus and Sir3p appears as telomeric spots. Sir3p is redistributed to a fragmented nucleolus in the nmt1–451D cell (colocalization of Sir3p and Nop1p in the nucleolus is seen as yellow).
Figure 3
Figure 3
ERC levels are increased in nmt1–451D cells. DNA was recovered from NMT1 cells (ABSC = 0.9 ± 1.1 and 7.2 ± 2.1) and isogenic nmt1–451D cells (ABSC = 0.9 ± 1.1 and 6.8 ± 2.6), and fractionated by agarose gel electrophoresis. Southern blots were probed with 32P-labeled rDNA. ERCs and their multimeric derivatives are indicated by arrows.
Figure 4
Figure 4
NMT1sip2Δ cells undergo rapid aging. (A) Sterility assay, performed as described in the legend to Fig. 1B. The shortened lifespan of these cells is accompanied by progressive sterility. (B) Multilabel immunohistochemical study of a sip2Δ cell at generation 12 (ABSC = 11.8 ± 3.6) showing Sir3p redistribution to a fragmented nucleolus. Note that 20%–25% of generation 12 sip2Δ cells exhibit these phenotypic changes (n = 1000 cells/scored per experiment; two independent experiments). (C) Increased ERC levels in sip2Δ cells. ABSC for the indicated generations were as follows: NMT1 (0.9 ± 1.1; 7.5 ± 2.8; 12.7 ± 4.1); NMT1sip2Δ (0.9 ± 1.1; 7.2 ± 2.3; 11.8 ± 3.6).
Figure 5
Figure 5
Loss of other N-myristoylproteins produces a shortening of lifespan without accompanying signs of aging or has no effect on lifespan. (A) Lifespans of the wild-type strain and isogenic strains containing null alleles of genes encoding two N-myrisotylproteins, Arf1p and Arf2p. (B) Sterility assay of arf1Δ cells.
Figure 6
Figure 6
ERC accumulation is reduced when Snf1p is deleted and augmented when Snf1p is overexpressed. Southern blot analysis of ERC accumulation in the indicated strains at generation 0–1 (ASBC = 0.9 ± 1.1) and at generation 7 (ASBC = 7.3 ± 2.6). Equal amounts of total cellular DNA were applied to all lanes. Note that in generation 7 wild-type cells containing YEp24–SNF1, the signal produced from hybridization of the labeled rDNA probe with ERCs, is >80% of the signal produced by reaction of the probe with total cellular DNA.
Figure 7
Figure 7
Removal of the Snf1p activator, Snf4p, rescues the reduced lifespan of sip2Δ cells. Strains YB810 (sip2Δ) and YB674 (sip2Δsnf4Δ) were derived from a S288C parent (YB322; see Table 1).
Figure 8
Figure 8
The cytoplasmic localization of a Mig1p–GFP fusion protein provides in vivo evidence for enhanced Snf1p kinase activity in sip2Δ cells. (A) Wild type and sip2Δ containing a CEN plasmid encoding Mig1p–GFP were sorted to the generations indicated. The intracellular distribution of Mig1p–GFP was then determined using fluorescence microscopy. Nomarski and fluorescence images of each field are shown. Arrows point to examples of cells where Mig–GFP is predominantly cytoplasmic. See text for further discussion. (B) Western blot of total cellular proteins isolated from young and old sip2Δ cells without (−) and with (+) a MIG1–GFP plasmid. Cells were recovered at the generational ages noted in parenthesis. The blot was probed with a GFP monoclonal antibody. The arrow points to the Mig1p–GFP fusion protein.
Figure 8
Figure 8
The cytoplasmic localization of a Mig1p–GFP fusion protein provides in vivo evidence for enhanced Snf1p kinase activity in sip2Δ cells. (A) Wild type and sip2Δ containing a CEN plasmid encoding Mig1p–GFP were sorted to the generations indicated. The intracellular distribution of Mig1p–GFP was then determined using fluorescence microscopy. Nomarski and fluorescence images of each field are shown. Arrows point to examples of cells where Mig–GFP is predominantly cytoplasmic. See text for further discussion. (B) Western blot of total cellular proteins isolated from young and old sip2Δ cells without (−) and with (+) a MIG1–GFP plasmid. Cells were recovered at the generational ages noted in parenthesis. The blot was probed with a GFP monoclonal antibody. The arrow points to the Mig1p–GFP fusion protein.
Figure 9
Figure 9
The rapid aging of sip2Δ cells is accompanied by increases in hexokinase activity and energy storage. (A) Hexokinase activity was measured in lysates prepared from individual mothers recovered at the indicated generations. Mean values ± 1 s.d. are plotted. (Asterisk) Values are significantly different (P < 0.05; Student's t-test) from generation 0–1 wild-type cells. (B) 2DG6P accumulation as a function of time in isogenic wild-type and sip2Δ cells. (C,D) Cellular ATP and NAD+ levels. The number of independently generated lysates/cell population/generational time point is noted (n = 50,000 cells assayed/lysate/experiment). Note that generation 4 in sip2Δ cells and generation 6–8 in wild-type cells represent equivalent fractions of their total lifespans. (E) Summary of fold differences in hexokinase, G6P, ATP, and NAD+ levels relative to young wild-type cells.

Similar articles

Cited by

References

    1. Alepuz PM, Cunningham KW, Estruch F. Glucose repression affects ion homeostasis in yeast through the regulation of the stress-activated ENA1 gene. Mol Microbiol. 1997;26:91–98. - PubMed
    1. Arking R. Biology of Aging. 2nd Edition. Sunderland, MA: Sinaur Associates; 1998.
    1. Arking R, Buck S, Berrios A, Dwyer S, Baker GT., III Elevated paraquat resistance can be used as a bioassay for longevity in a genetically based long-lived strain of Drosophila. Dev Genet. 1991;12:362–370. - PubMed
    1. Ashrafi K, Farazi TA, Gordon JI. A role for Saccharomyces cerevisiae fatty acid activation protein 4 in regulating protein N-myristoylation during entry into stationary phase. J Biol Chem. 1998;273:25864–25874. - PubMed
    1. Ashrafi K, Sinclair D, Gordon JI, Guarente L. Passage through stationary phase advances replicative aging in Saccharomyces cerevisiae. Proc Natl Acad Sci. 1999;96:9100–9105. - PMC - PubMed

Publication types

MeSH terms