. 2000 Aug 1;14(15):1886-98.

Inactivation of mouse Hus1 results in genomic instability and impaired responses to genotoxic stress

Affiliations

Inactivation of mouse Hus1 results in genomic instability and impaired responses to genotoxic stress

R S Weiss et al. Genes Dev. .

Abstract

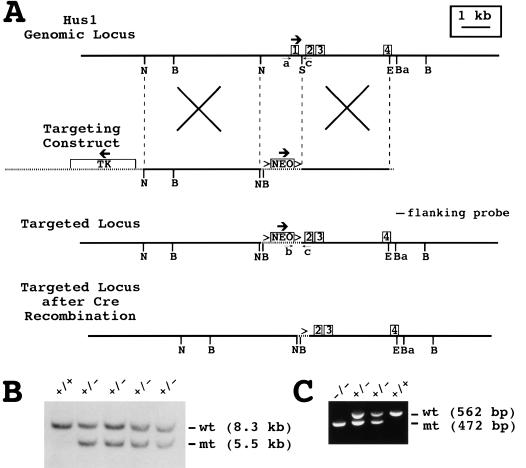
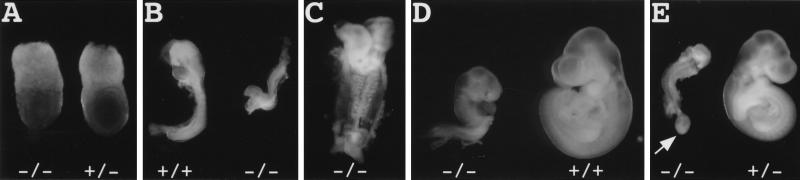
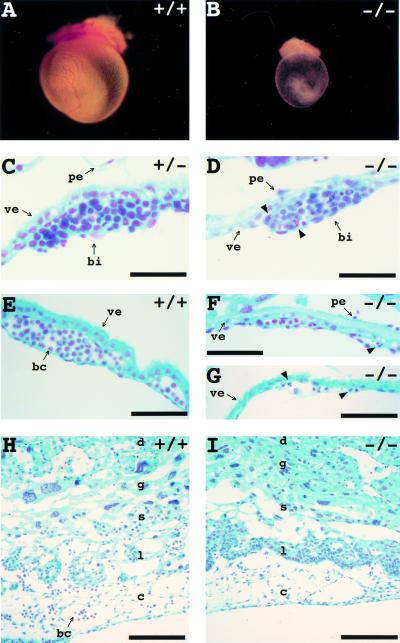
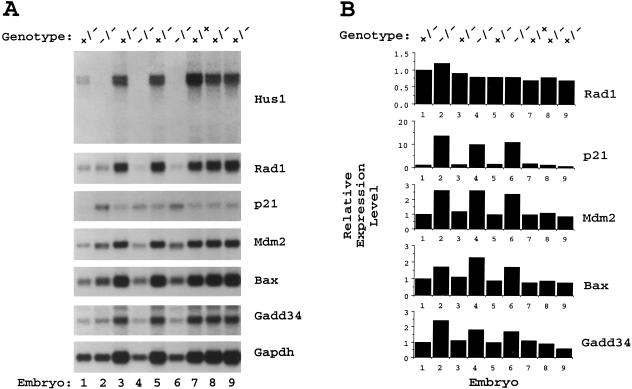
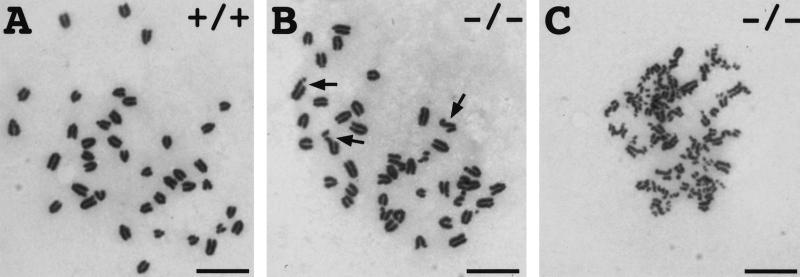
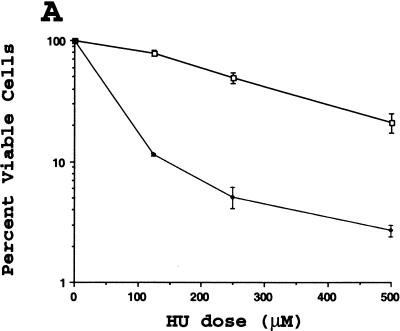
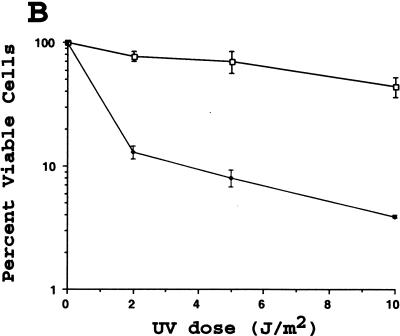
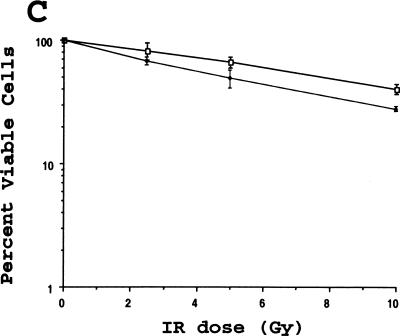
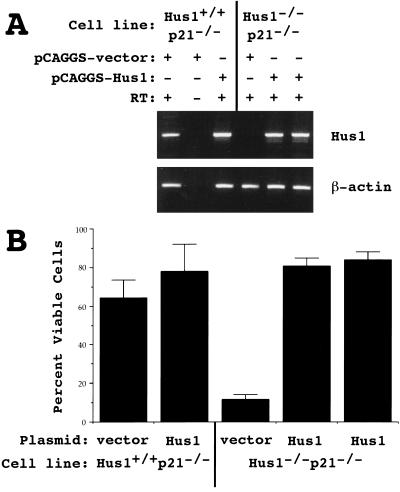
The eukaryotic cell cycle is overseen by regulatory mechanisms, termed checkpoints, that respond to DNA damage, mitotic spindle defects, and errors in the ordering of cell cycle events. The DNA replication and DNA damage cell cycle checkpoints of the fission yeast Schizosaccharomyces pombe require the hus1(+) (hydroxyurea sensitive) gene. To determine the role of the mouse homolog of hus1(+) in murine development and cell cycle checkpoint function, we produced a targeted disruption of mouse Hus1. Inactivation of Hus1 results in mid-gestational embryonic lethality due to widespread apoptosis and defective development of essential extra-embryonic tissues. DNA damage-inducible genes are up-regulated in Hus1-deficient embryos, and primary cells from Hus1-null embryos contain increased spontaneous chromosomal abnormalities, suggesting that loss of Hus1 leads to an accumulation of genome damage. Embryonic fibroblasts lacking Hus1 fail to proliferate in vitro, but inactivation of p21 allows for the continued growth of Hus1-deficient cells. Hus1(-/-)p21(-/-) cells display a unique profile of significantly heightened sensitivity to hydroxyurea, a DNA replication inhibitor, and ultraviolet light, but only slightly increased sensitivity to ionizing radiation. Taken together, these results indicate that mouse Hus1 functions in the maintenance of genomic stability and additionally identify an evolutionarily-conserved role for Hus1 in mediating cellular responses to genotoxins.


Figures

Figure 1
Figure 1
Targeted disruption of the mouse Hus1 gene. (A) Restriction maps of the Hus1 genomic locus, targeting construct, targeted locus, and targeted locus following cre-mediated recombination. The first four Hus1 exons are shown as boxes. Vector-derived sequences are shown as stippled lines, and thick arrows indicate the direction of transcription for the Hus1, neomycin resistance (Neo), and thymidine kinase (Tk) genes. LoxP sites are represented by the (>) symbols. The positions of the flanking probe and PCR primers a, b, and c used for genotyping are indicated. Homologous recombination of the targeting construct is depicted by the large Xs. (B) BglI, (Ba) BamHI, (E) EcoRV, (N) NheI, (S) SmaI. (B) Southern blot analysis of ES cell genomic DNA. Genomic DNA from wild-type TC-1 cells (+/+) or four independent targeted ES cell clones (+/−) was digested with BglI and hybridized with the flanking probe. The positions of the bands corresponding to the wild-type (wt) and targeted mutant (mt) Hus1 alleles are indicated. (C) Representative PCR analysis of yolk sac genomic DNA obtained from progeny of a Hus1 heterozygote intercross using the primers shown in A. The positions of PCR products from the wild-type (wt) and targeted mutant (mt) Hus1 alleles are indicated.
Figure 2
Figure 2
Morphology of Hus1 embryos. Embryos from timed Hus1 heterozygote intercrosses were photographed at the time of dissection and genotyped thereafter. (A) 7.5 dpc, (B) 8.5 dpc, (CE) 9.5 dpc. Arrow in E indicates hydropic allantois.
Figure 3
Figure 3
Abnormal development of yolk sac and placenta in Hus1−/− embryos. (A,B) Hus1 embryos at 9.5 dpc were photographed following removal of deciduum, trophoblast giant cells, and Reichert's membrane. (CI) Sections of embryos from timed Hus1 heterozygote intercrosses were stained by the Feulgen method. (C,D) 8.5 dpc blood islands; (EG) 9.5 dpc yolk sacs; (H,I) 9.5 dpc placentas. Arrowheads indicate some of the cells with pyknotic or otherwise abnormal nuclei. Abbreviations: (bc) blood cell, (bi) blood island, (c) chorionic plate, (d) maternal decidua, (g) trophoblast giant cell layer, (l) labyrinthine layer, (pe) parietal endoderm, (s) spongiotrophoblast layer, (ve) visceral endoderm. Size bars: (C,D) 31 μm; (EG) 62.5 μm; (H,I) 125 μm.
Figure 4
Figure 4
Increased apoptosis but normal cell proliferation in Hus1−/− embryos. (AD,FI) Sections of Hus1 embryos were stained by the TUNEL method. (A,F) 7.5 dpc, (B,G) 8.0 dpc, (C,H) higher magnification view of boxed region in B and G, (D,I) 8.5 dpc. Arrows in A, C, F, and H indicate some of the TUNEL-positive apoptotic cells, which are darkly-stained in contrast to the methyl green counterstain. (E,J) Sections of BrdU-labeled Hus1 embryos at 7.5 dpc were stained with an anti-BrdU antibody. BrdU-positive cells are darkly-stained in contrast to the hematoxylin (blue) counterstain. Size bars: (A,D,F,I) 125 μm; (B,G) 250 μm; (C,E,H,J) 62.5 μm.
Figure 5
Figure 5
Lack of detectable Hus1 transcripts but elevated expression of DNA damage-inducible genes in Hus1−/− embryos. (A) Northern blot analysis of 8.5 dpc embryos from a timed Hus1 heterozygote intercross. Total RNA was prepared from individual embryos and subjected to Northern blot hybridization with the indicated 32P-labeled cDNA probes. Note that Hus1−/− embryos are smaller than normal embryos at 8.5 dpc and therefore appear to be under-loaded. A portion of the RNA from embryo number one was lost during sample preparation and thus approximately equal amounts of RNA were obtained from this Hus1+/− embryo and the Hus1−/− embryos. (B) Quantitative analysis of gene expression levels. Radioactive signal intensity was quantitated with a PhosphorImager. Values were normalized based on results for the loading control Gapdh, and for each cDNA probe the expression level in each embryo is shown relative to the signal for embryo one, which was assigned an arbitrary expression level of one.
Figure 6
Figure 6
Chromosomal abnormalities in primary cultures of Hus1−/− embryos. Metaphase spreads were prepared from primary cultures of 9.5 dpc Hus1 embryos and stained with Giemsa. Shown are: (A) A normal Hus1+/+ metaphase, (B) a Hus1−/− metaphase containing multiple chromatid breaks, and (C) a Hus1−/− metaphase with extensive chromosome damage. Arrows in B indicate some of the chromatid breaks. Size bar: 12.5 μm.
Figure 7
Figure 7
Increased sensitivity of Hus1-deficient cells to certain genotoxins. Hus1+/+p21−/− (□) or Hus1−/−p21−/− (♦) MEFs were plated in 6-well culture dishes and treated with the indicated doses of (A) HU, (B) UV, or (C) IR as described in Materials and Methods. Cell viability was assessed 72 hr after treatment and is plotted as the percent viable cells relative to results for untreated control cultures. Each point represents the mean of three samples, with error bars showing standard deviation. The plots are representative of results obtained for three independent Hus1−/−p21−/− and matched control Hus1+/+p21−/− MEF cultures.
Figure 7
Figure 7
Increased sensitivity of Hus1-deficient cells to certain genotoxins. Hus1+/+p21−/− (□) or Hus1−/−p21−/− (♦) MEFs were plated in 6-well culture dishes and treated with the indicated doses of (A) HU, (B) UV, or (C) IR as described in Materials and Methods. Cell viability was assessed 72 hr after treatment and is plotted as the percent viable cells relative to results for untreated control cultures. Each point represents the mean of three samples, with error bars showing standard deviation. The plots are representative of results obtained for three independent Hus1−/−p21−/− and matched control Hus1+/+p21−/− MEF cultures.
Figure 8
Figure 8
Restoration of Hus1 expression complements the UV sensitivity of Hus1-deficient cells. Hus1−/−p21−/− and Hus1+/+p21−/− MEFs were stably transfected with either an empty expression plasmid vector (pCAGGS–vector) or an expression plasmid encoding Hus1 (pCAGGS–Hus1). (A) Gene expression in individual stable clones was analyzed by RT–PCR, with primers specific for Hus1 (top) or β-actin (bottom). (B) The indicated cell lines were treated with 5 J/m2 of UV and cell viability was assessed 72 hr after treatment. Values are the mean of three samples, with error bars showing standard deviation.

Similar articles

Cited by

References

    1. Ahmed S, Hodgkin J. MRT-2 checkpoint protein is required for germline immortality and telomere replication in C. elegans. Nature. 2000;403:159–164. - PubMed
    1. Al-Khodairy F, Carr AM. DNA repair mutants defining G2 checkpoint pathways in Schizosaccharomyces pombe. EMBO J. 1992;11:1343–1350. - PMC - PubMed
    1. Al-Khodairy F, Fotou E, Sheldrick KS, Griffiths DJ, Lehmann AR, Carr AM. Identification and characterization of new elements involved in checkpoint and feedback controls in fission yeast. Mol Biol Cell. 1994;5:147–160. - PMC - PubMed
    1. Aravind L, Walker DR, Koonin EV. Conserved domains in DNA repair proteins and evolution of repair systems. Nucleic Acids Res. 1999;27:1223–1242. - PMC - PubMed
    1. Bates S, Vousden KH. Mechanisms of p53-mediated apoptosis. Cell Mol Life Sci. 1999;55:28–37. - PMC - PubMed

Publication types

MeSH terms

LinkOut - more resources