Clinical Trial
. 2000 Aug 1;526 Pt 3(Pt 3):671-81.
doi: 10.1111/j.1469-7793.2000.00671.x.

The force-velocity relationship of human adductor pollicis muscle during stretch and the effects of fatigue

Affiliations
Clinical Trial

The force-velocity relationship of human adductor pollicis muscle during stretch and the effects of fatigue

C J Ruiter et al. J Physiol. .

Abstract

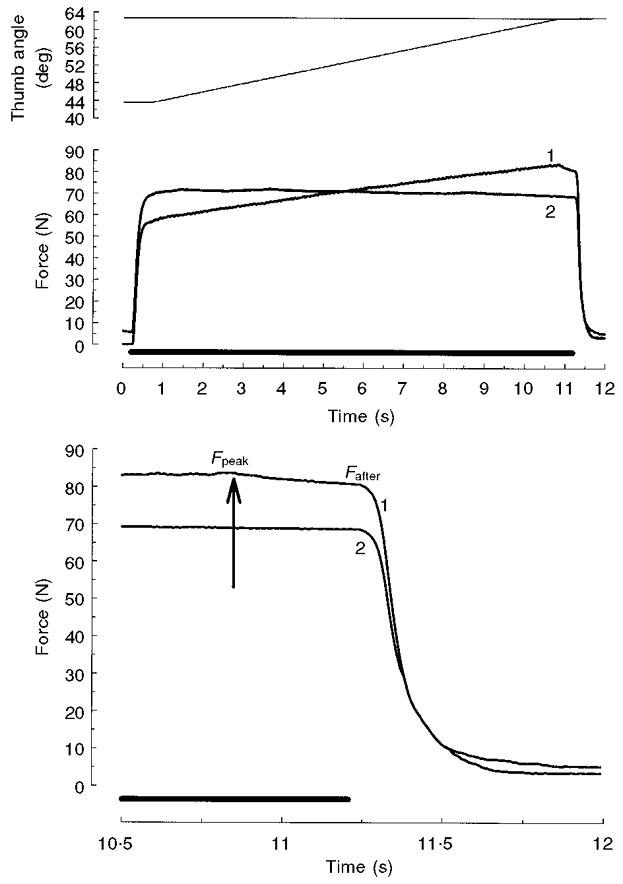
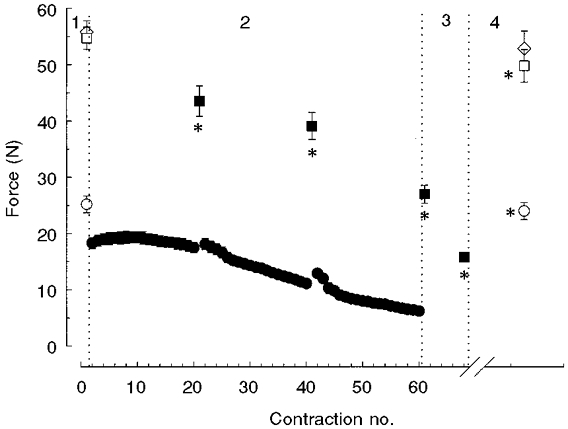
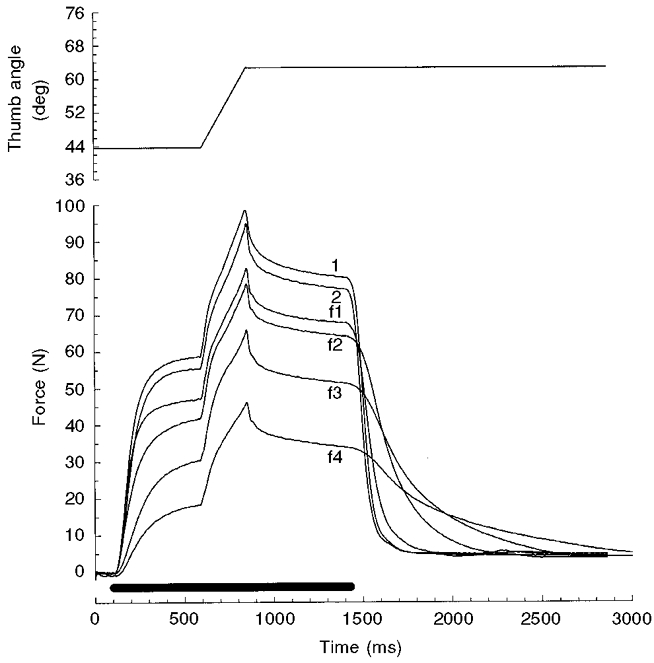
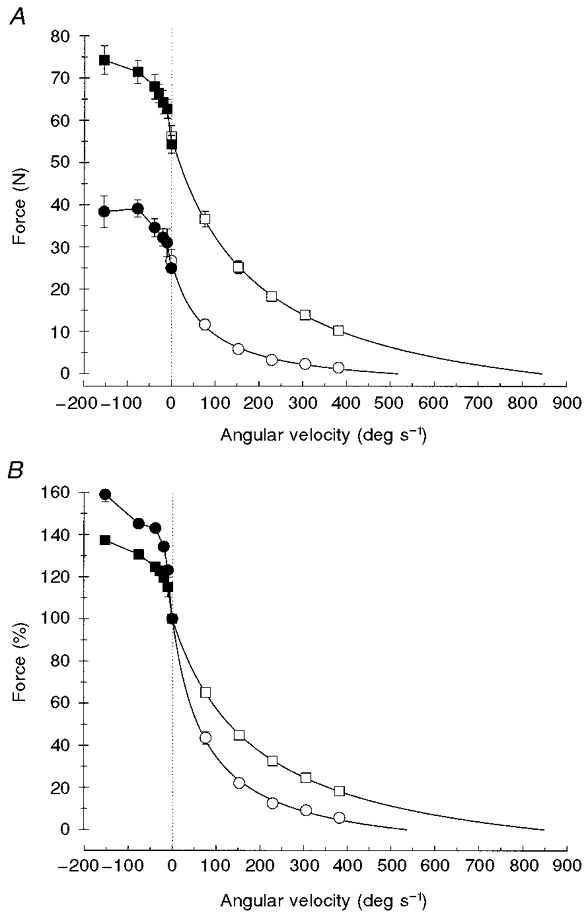
We have examined the force-velocity characteristics of tetanically activated human adductor pollicis working in vivo, in the fresh and fatigued states. The increase in force in response to stretch was divided into two major components. The first, steady, component persisted after the stretch and is concluded not to be a function of active cycling cross-bridges because it was not affected by either the velocity of the stretch or the level of muscle activation. The origin of the second, transient, component of the increased force seen during stretch is consistent with cross-bridge activity since it increased with increasing velocity of stretch and was proportional to the level of activation. It is likely that both components of the stretch response make a significant contribution to muscle performance when acting to resist a force. For the fastest stretch used, the contributions of cross-bridge and non-cross-bridge mechanisms were equal. For the slowest stretch, lasting 10 s and over the same distance, the force response was attributed almost entirely to non-cross-bridge mechanisms. As a result of acute fatigue (50 % isometric force loss) there were only small reductions in the non-cross-bridge component of the force response to stretch, while the cross-bridge component decreased in absolute terms. The transient component of the stretch response increased as a result of fatigue, relative to the isometric force, while the force during shortening decreased. The results are consistent with a decrease in cross-bridge turnover in fatigued muscle.


Figures

Figure 1
Figure 1. Force-thumb angle relationships of adductor pollicis muscle
Total (•), passive (▾) and active (total – passive; ○) force (n = 8, means ±s.e.m.) at different thumb angles. The standard stretch trajectory (44-63 deg) is indicated by the arrow.
Figure 2
Figure 2. Force record during and following isovelocity stretches at 76.4 deg s−1
Angular displacement (top) and force data (bottom) for one subject. Stimulation (indicated by the bars above the time axis) was either at 80 Hz (traces 1 and 2) or 30 Hz (traces 3 and 4). Vertical dotted lines indicate where the forces were measured, before (Fbefore), at the peak (Fpeak) and 500 ms following the stretch (Fafter). The thick traces are the force responses before, during and after stretches from 44 to 63 deg thumb angle at 76.4 deg s−1. Note that with both the 80 and 30 Hz stimulation, the isometric force after the stretch (Fafter) was enhanced compared to the isometric forces at the 63 deg thumb angle without a preceding stretch (thin traces).
Figure 3
Figure 3. Proposed components of stretch-induced force enhancement (modelled data)
The maximally activated adductor pollicis muscle was stretched by abduction of the thumb (at 76.4 deg s−1) from the isometric force plateau at the 44 deg thumb angle (top panel). Component A is the force response of cross-bridges to constant velocity stretch. Component B is the length-dependent element. Component C follows the total (= active + passive) force-thumb angle relationship of the muscle. The difference between isometric force after and before the stretch (FafterFbefore) was used as a measure of the steady component of the stretch-induced force enhancement, reflecting the combined effects of components B and C. The difference between the peak force (Fpeak) and Fafter was used to quantify the transient component A. Note that this is a qualitative model and that the absolute force values (y-axis) were added following analysis of the data to give an impression of the relative contribution of each of the three components to the total force output during a stretch at 76.4 deg s−1.
Figure 4
Figure 4. The effects of the isometric force level before stretch and stretch velocity on two different force components
The dependency of the steady component (A and B) and the transient component (C and D) on Fbefore and stretch velocity, in the fresh (○) and fatigued (▪) muscle. See Figs 1 and 2 for explanations of Fbefore, Fafter and Fpeak. All data in A and C are from stretches at 76.4 deg s−1; the numbers indicate the different conditions used to vary Fbefore: 1, standard condition: stretches from 44 to 63 deg, 80 Hz stimulation; 2, from 44 to 63 deg, recovered muscle; 3, from 36 to 55 deg; 4, from 36 to 55 deg, recovered muscle; 5, from 44 to 63 deg, 30 Hz stimulation; 6, from 44 to 63 deg, 30 Hz stimulation, recovered muscle. f1, f2, f3, respectively, are from the 20th, 40th and 60th contraction during the fatigue protocol and f4 and f5 (stretches from 36 to 55 deg) are data from the last contractions in the fatigued state. Note the linear relationship between Fbefore and FpeakFafter in the unfatigued muscle (C, 1-6): y = 0.38 x– 4.0 (r2= 0.97). *Significantly different from unfatigued value.
Figure 5
Figure 5. Force in response to stretch at 1.9 deg s−1
Example of an additional experiment in which the adductor pollicis muscle was either stretched from 44 to 63 deg at a very low velocity (1.9 deg s−1; trace 1) or isometrically stimulated for the same duration at the 63 deg thumb angle (trace 2). Data are from the same subject as in Fig. 2. The top panel shows angular displacement. Stimulation (50 Hz) is indicated by the bar above the time axes. The last part of the force traces (middle panel) is shown enlarged in the bottom panel, where the arrow indicates the end of the stretch. Note that isometric force following the stretch (Fafter) was considerably enhanced compared to the isometric force without a preceding stretch (trace 2); also note that peak stretch force (Fpeak) was only 3.1 N higher than Fafter.
Figure 6
Figure 6. Force changes during the ischaemic fatigue protocol
Concentric force during shortening at 152.8 deg s−1 (circles) and isometric force at the 44 deg thumb angle (squares) before (1, open symbols), during (2) the fatigue protocol, in the fatigued state (3) and following 6 min recovery (4, open symbols). Baseline values (1,4) for isometric force at the 51 deg thumb angle (open diamonds) are also shown. Note that the relatively low value for concentric force at the start of the fatigue protocol compared to the baseline value is due to the lower stimulation frequency (50 instead of 150 Hz) applied during the protocol. *Significantly different from the unfatigued value (1).
Figure 7
Figure 7. Examples of force during and immediately following isovelocity stretches at 76.4 deg s−1 at different levels of fatigue
The six force traces are of one subject and illustrate the force responses in the unfatigued (1) and recovered (2) muscle, and during increasing fatigue (f1-f4). Traces f3 and f4, respectively, are the first and last contraction of the series applied following the fatigue protocol. Note the further reduction of force and the more pronounced slowing of relaxation in f4 compared to f3.
Figure 8
Figure 8. Force-velocity relationships of human adductor pollicis muscle
Force-velocity relationships for concentric (open symbols) and eccentric (filled symbols) contractions for unfatigued (squares) and fatigued muscle (circles), in absolute values (A) and relative to the maximal isometric force (B). Eccentric forces were calculated by subtracting the steady component (FafterFbefore) from Fpeak. Note that the data obtained with stretches at 76.4 deg s−1 in the fatigued state were affected by a sequence effect (see text for explanation).

References

    1. Abbott BC, Aubert XM. The force exerted by active striated muscle during and after change of length. The Journal of Physiology. 1952;117:77–86. - PMC - PubMed
    1. Allen DJ, Lee JA, Westerblad H. Intracellular calcium and tension during fatigue in isolated single muscle fibres from Xenopus laevis. The Journal of Physiology. 1989;415:433–458. - PMC - PubMed
    1. Cook CS, McDonagh MJN. Force responses to controlled stretches of electrically stimulated human muscle-tendon complex. Experimental Physiology. 1995;80:477–490. - PubMed
    1. Curtin NA, Edman KAP. Force-velocity relation for frog muscle fibres: effects of moderate fatigue and intracellular acidification. The Journal of Physiology. 1994;475:483–494. - PMC - PubMed
    1. De Haan A. The influence of stimulation frequency on force-velocity characteristics of in situ rat medial gastrocnemius muscle. Experimental Physiology. 1998;83:77–84. - PubMed

Publication types

LinkOut - more resources