

An endogenous circadian rhythm of respiratory control in humans
- PMID: 10922018
- PMCID: PMC2270042
- DOI: 10.1111/j.1469-7793.2000.00683.x
An endogenous circadian rhythm of respiratory control in humans
Erratum in
- Am J Respir Crit Care Med 2002 Oct 1;166(7):1005
Abstract
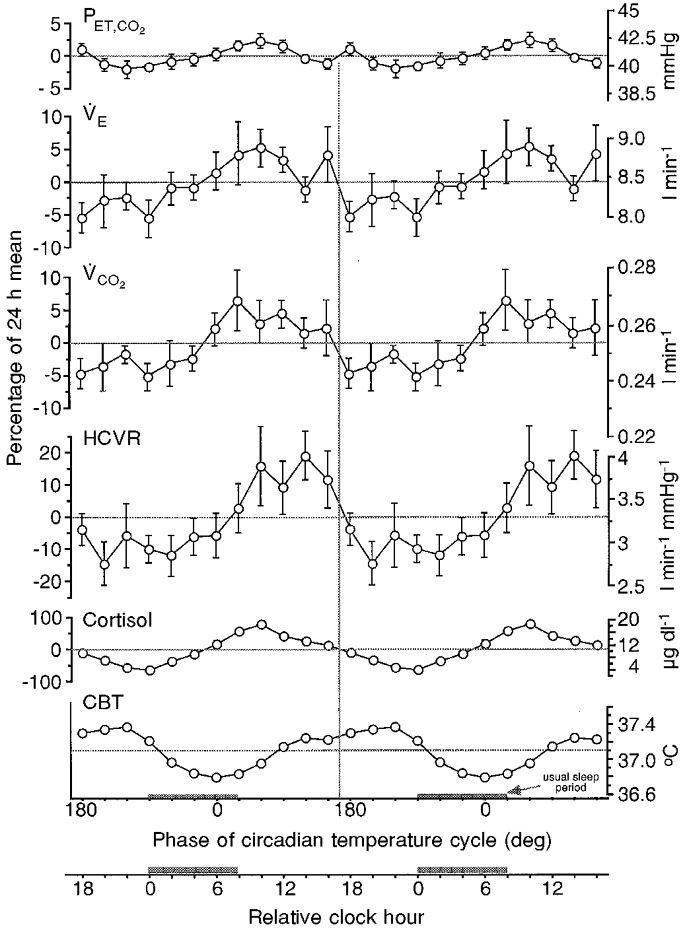
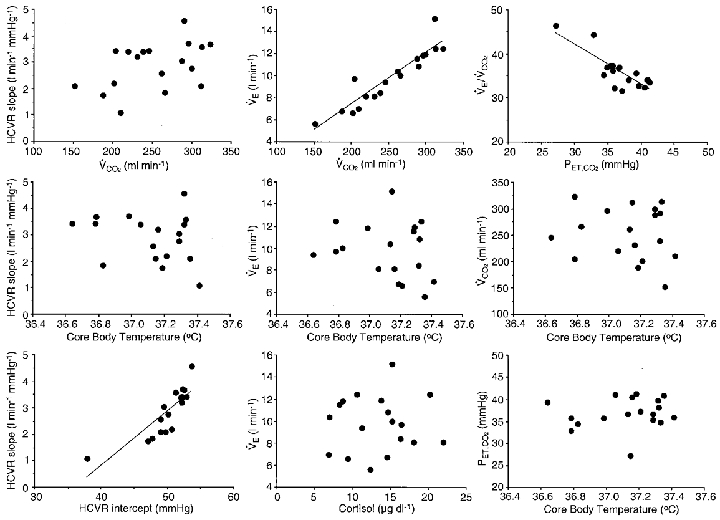
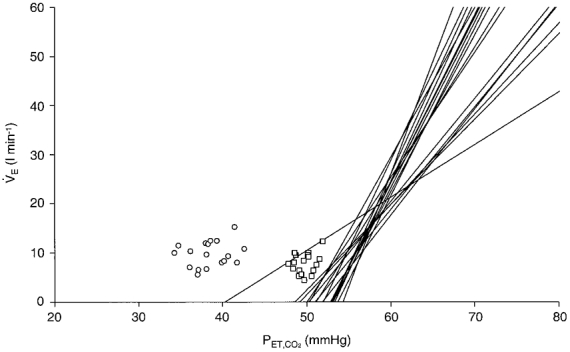
Many physiological and behavioural functions have circadian rhythms - endogenous oscillations with a period of approximately 24 h that can occur even in the absence of sleep. We determined whether there is an endogenous circadian rhythm in breathing, metabolism and ventilatory chemosensitivity in humans. Ten healthy, adult males were studied throughout 4 days in a stable laboratory environment. After two initial baseline days (16 h wakefulness plus 8 h sleep) that served to achieve a steady state, subjects were studied under constant behavioural and environmental conditions throughout 41 h of wakefulness. Ventilation, metabolism and the magnitude of the hypercapnic ventilatory response (HCVR) were measured every 2 h. Individuals' data were aligned according to circadian phase (core body temperature minimum; CBTmin) and averaged. In the group average data, there was a significant and large amplitude circadian variation in HCVR slope (average of +/-0.4 l min-1 mmHg-1; corresponding to +/-12.1 % of 24 h mean), and a smaller amplitude rhythm in the HCVR x-axis intercept (average of +/-1.1 mmHg; +/-2.1 % of 24 h mean). Despite a significant circadian variation in metabolism (+/-3.2 % of 24 h mean), there were no detectable rhythms in tidal volume, respiratory frequency or ventilation. This small discrepancy between metabolism and ventilation led to a small but significant circadian variation in end-tidal PCO2 (PET,CO2; +/-0.6 mmHg; +/-1.5 % of 24 h mean). The circadian minima of the group-averaged respiratory variables occurred 6-8 h earlier than CBTmin, suggesting that endogenous changes in CBT across the circadian cycle have less of an effect on respiration than equivalent experimentally induced changes in CBT. Throughout these circadian changes, there were no correlations between HCVR parameters (slope or x-axis intercept) and either resting ventilation or resting PET,CO2. This suggests that ventilation and PET,CO2 are little influenced by central chemosensory respiratory control in awake humans even when at rest under constant environmental and behavioural conditions. The characteristic change in PET,CO2 during non-rapid eye movement sleep was shown to be independent of circadian variations in PET,CO2, and probably reflects a change from predominantly behavioural to predominantly chemosensory respiratory control. This study has documented the existence and magnitude of circadian variations in respiration and respiratory control in awake humans for the first time under constant behavioural and environmental conditions. These results provide unique insights into respiratory control in awake humans, and highlight the importance of considering the phase of the circadian cycle in studies of respiratory control.
Figures
References
-
- Baker JF, Goode RC, Duffin J. The effect of a rise in body temperature on the central-chemoreflex ventilatory response to carbon dioxide. European Journal of Applied Physiology. 1996;72:537–541. - PubMed
-
- Berger RJ, Phillips NH. Comparative aspects of energy metabolism, body temperature and sleep. Acta Physiologica Scandinavica. 1988;574:21–27. - PubMed
-
- Berry RB, Gleeson K. Respiratory arousal from sleep: mechanisms and significance. Sleep. 1997;20:654–675. - PubMed
-
- Brown EN, Czeisler CA. The statistical analysis of circadian phase and amplitude in constant-routine core-temperature data. Journal of Biological Rhythms. 1992;7:177–202. - PubMed
-
- Bulow K. Respiration and wakefulness in man. Acta Physiologica Scandinavica. 1963;59:7–99. - PubMed
Publication types
MeSH terms
Substances
Grants and funding
LinkOut - more resources
Full Text Sources
Other Literature Sources
Miscellaneous