

Comment
doi: 10.1073/pnas.97.16.8747.
Shattering the diffraction limit of light: a revolution in fluorescence microscopy?
Affiliations
- PMID: 10922028
- PMCID: PMC34005
- DOI: 10.1073/pnas.97.16.8747
Item in Clipboard
Comment
Shattering the diffraction limit of light: a revolution in fluorescence microscopy?
Proc Natl Acad Sci U S A.
.
No abstract available
Figures
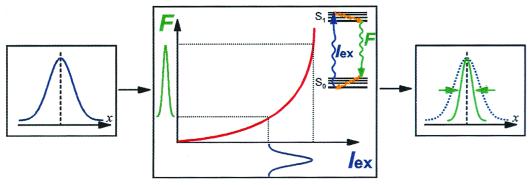
A nonlinear relationship between the fluorescence emission (F)
and the excitation light (Iex) “shrinks” the
emission PSF. An excitation “input” PSF (blue,
Left) will be converted into an emission “output”
PSF (green, Right) via a “nonlinear fluorescence
box” (Center). The Jablonski diagram at the top right
of the “fluorescence box” describes an arbitrary nonlinear
excitation process (although only one wavy arrow is shown for
Iex, it can describe a multiphoton process). The output PSF
is normalized and compared with the input PSF.
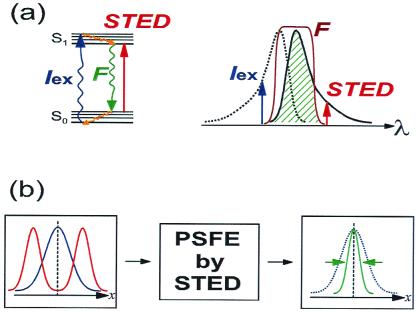
PSFE by STED. (a Left) A Jablonski diagram showing the
ground (S0) and the first excited singlet (S1)
states of a fluorophore with the corresponding vibrational manifolds.
The fluorophore acts as an effective four-level system because the
vibrational relaxations of S1 and S0 are fast
compared with the fluorescence lifetime. A short pulse
(Iex, 200 fs) excites the fluorophore into a high
vibrational state of S1. The slow STED pulse (STED, 40 ps)
stimulates emission from the lowest S1 vibrational state
into a high vibrational state of S0. The stimulated
emission depletes S1 and quenches the fluorescence.
(Right) The equivalent wavelength diagram showing the
absorption curve (dotted black line), the emission curve (solid black
line), and the positions of Iex, STED and the filter (F).
The filter blocks the two lasers and passes the signal (hatched green).
(b) The combination of the excitation PSF (blue) with
the STED engineered intensity distribution (red) acts as an input to
the PSFE by STED “nonlinear box.” The output PSF (green) is
shrunk.
Comment on
-
Fluorescence microscopy with diffraction resolution barrier broken by stimulated emission.Proc Natl Acad Sci U S A. 2000 Jul 18;97(15):8206-10. doi: 10.1073/pnas.97.15.8206. Proc Natl Acad Sci U S A. 2000. PMID: 10899992 Free PMC article.
References
-
- Abbe E. Archiv für Mikroskopische Anat Entwicklungsmech. 1873;9:413–468.
-
- Dunn R C. Chem Rev. 1999;99:2891–2927. - PubMed
-
- Inouye Y, Kawata S. Opt Lett. 1994;19:159–161. - PubMed
-
- Carrington W A, Lynch R M, Moore E D W, Isenberg G, Fogarty K E, Fay F S. Science. 1995;268:1483–1487. - PubMed
-
- Hell S, Stelzer E H K. J Opt Soc Am A. 1992;9:2159–2166.
Publication types
MeSH terms
LinkOut - more resources
Full Text Sources
Other Literature Sources
