

Genome-wide expression profiling of mid-gestation placenta and embryo using a 15,000 mouse developmental cDNA microarray
- PMID: 10922068
- PMCID: PMC16833
- DOI: 10.1073/pnas.97.16.9127
Genome-wide expression profiling of mid-gestation placenta and embryo using a 15,000 mouse developmental cDNA microarray
Abstract
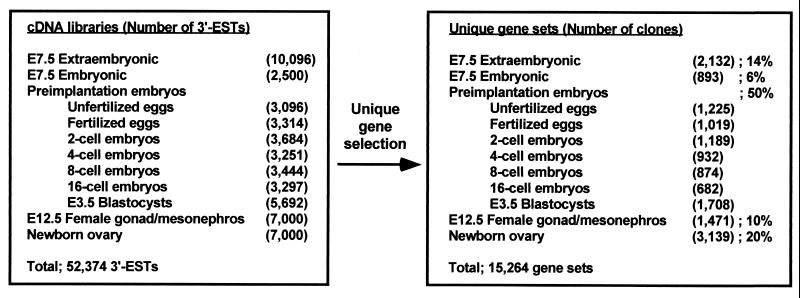
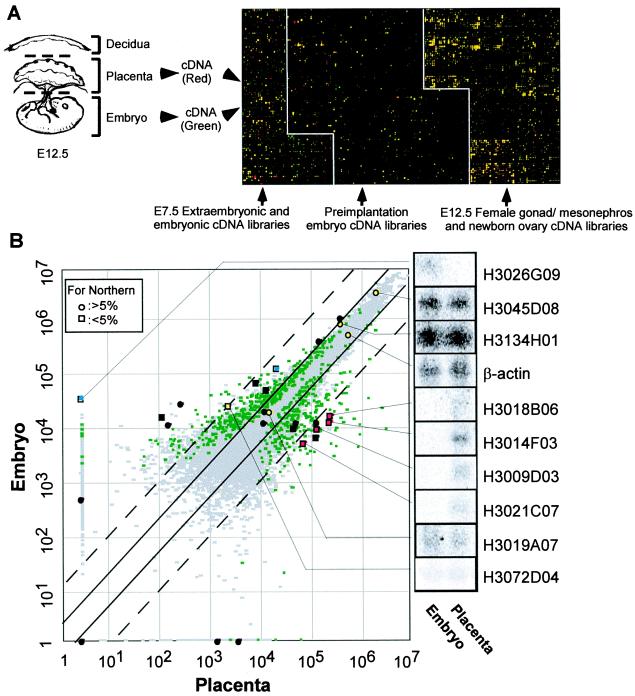
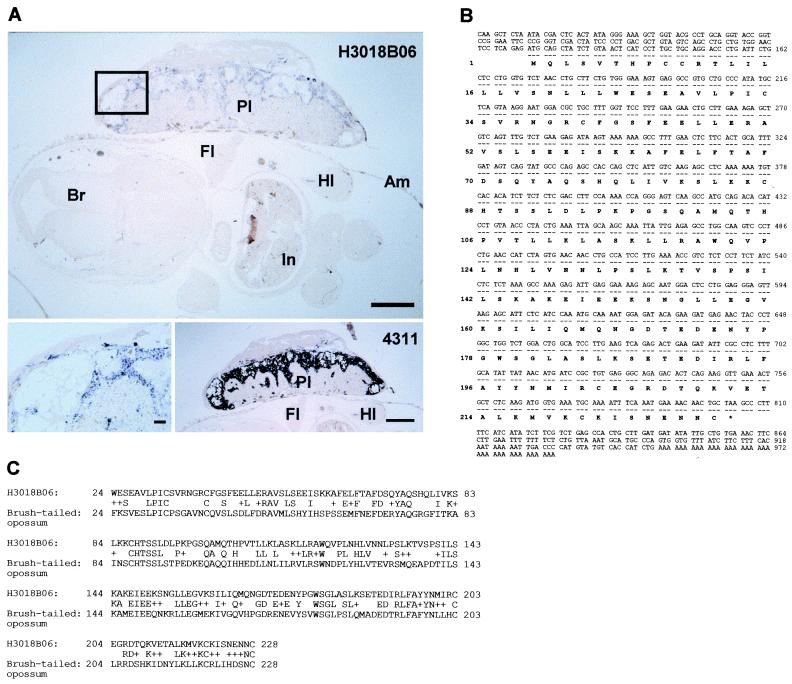
cDNA microarray technology has been increasingly used to monitor global gene expression patterns in various tissues and cell types. However, applications to mammalian development have been hampered by the lack of appropriate cDNA collections, particularly for early developmental stages. To overcome this problem, a PCR-based cDNA library construction method was used to derive 52,374 expressed sequence tags from pre- and peri-implantation embryos, embryonic day (E) 12.5 female gonad/mesonephros, and newborn ovary. From these cDNA collections, a microarray representing 15,264 unique genes (78% novel and 22% known) was assembled. In initial applications, the divergence of placental and embryonic gene expression profiles was assessed. At stage E12.5 of development, based on triplicate experiments, 720 genes (6.5%) displayed statistically significant differences in expression between placenta and embryo. Among 289 more highly expressed in placenta, 61 placenta-specific genes encoded, for example, a novel prolactin-like protein. The number of genes highly expressed (and frequently specific) for placenta has thereby been increased 5-fold over the total previously reported, illustrating the potential of the microarrays for tissue-specific gene discovery and analysis of mammalian developmental programs.
Figures
Similar articles
-
An abundant placental transcript containing an IAP-LTR is allelic to mouse pregnancy-specific glycoprotein 23 (Psg23): cloning and genetic analysis.Gene. 2004 Jan 21;325:103-13. doi: 10.1016/j.gene.2003.10.001. Gene. 2004. PMID: 14697515
-
cDNA microarray analysis of bovine embryo gene expression profiles during the pre-implantation period.Reprod Biol Endocrinol. 2004 Nov 24;2:77. doi: 10.1186/1477-7827-2-77. Reprod Biol Endocrinol. 2004. PMID: 15560851 Free PMC article.
-
Identification and characterization of a new member of the placental prolactin-like protein-C (PLP-C) subfamily, PLP-Cbeta.Endocrinology. 2000 Sep;141(9):3343-52. doi: 10.1210/endo.141.9.7635. Endocrinology. 2000. PMID: 10965907
-
Psx, a novel murine homeobox gene expressed in placenta.Gene. 1998 Jan 30;207(2):159-66. doi: 10.1016/s0378-1119(97)00620-3. Gene. 1998. PMID: 9511757
-
Bioinformatics beyond sequence: mapping gene function in the embryo.Nat Rev Genet. 2001 Jun;2(6):409-17. doi: 10.1038/35076500. Nat Rev Genet. 2001. PMID: 11389457 Review.
Cited by
-
Antisense DNAs as multisite genomic modulators identified by DNA microarray.Proc Natl Acad Sci U S A. 2001 Aug 14;98(17):9819-23. doi: 10.1073/pnas.171314398. Epub 2001 Jul 31. Proc Natl Acad Sci U S A. 2001. PMID: 11481453 Free PMC article.
-
RESOURCERER: a database for annotating and linking microarray resources within and across species.Genome Biol. 2001;2(11):SOFTWARE0002. doi: 10.1186/gb-2001-2-11-software0002. Genome Biol. 2001. PMID: 16173164 Free PMC article.
-
Gene expression profiling of the hypoxia signaling pathway in hypoxia-inducible factor 1alpha null mouse embryonic fibroblasts.Gene Expr. 2003;11(3-4):181-97. doi: 10.3727/000000003108749062. Gene Expr. 2003. PMID: 14686790 Free PMC article.
-
A genome-wide single nucleotide polymorphism and copy number variation analysis for number of piglets born alive.BMC Genomics. 2019 Apr 27;20(1):321. doi: 10.1186/s12864-019-5687-0. BMC Genomics. 2019. PMID: 31029102 Free PMC article.
-
Long non-coding RNA deep sequencing reveals the role of macrophage in liver disorders.Oncotarget. 2017 Dec 12;8(70):114966-114979. doi: 10.18632/oncotarget.23154. eCollection 2017 Dec 29. Oncotarget. 2017. PMID: 29383134 Free PMC article.
References
-
- Ferea T L, Brown P O. Curr Opin Genet Dev. 1999;9:715–722. - PubMed
-
- Duggan D J, Bittner M, Chen Y, Meltzer P, Trent J M. Nat Genet. 1999;21:10–14. - PubMed
-
- DeRisi J L, Iyer V R, Brown P O. Science. 1997;278:680–686. - PubMed
-
- Chu S, DeRisi J, Eisen M, Mulholland J, Botstein D, Brown P O, Herskowitz I. Science. 1998;282:699–705. - PubMed
MeSH terms
Substances
Associated data
- Actions
- Actions
- Actions
- Actions
- Actions
- Actions
- Actions
- Actions
- Actions
- Actions
- Actions
- Actions
- Actions
- Actions
- Actions
- Actions
- Actions
- Actions
- Actions
- Actions
- Actions
- Actions
- Actions
- Actions
- Actions
- Actions
- Actions
- Actions
- Actions
- Actions
LinkOut - more resources
Full Text Sources
Other Literature Sources
Molecular Biology Databases
Research Materials
