. 2000 Aug 1;97(16):9226-33.
doi: 10.1073/pnas.97.16.9226.

Positron emission tomography provides molecular imaging of biological processes

Affiliations

Positron emission tomography provides molecular imaging of biological processes

M E Phelps. Proc Natl Acad Sci U S A. .

Abstract

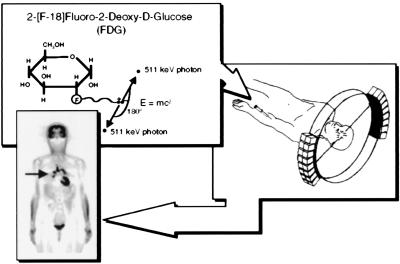
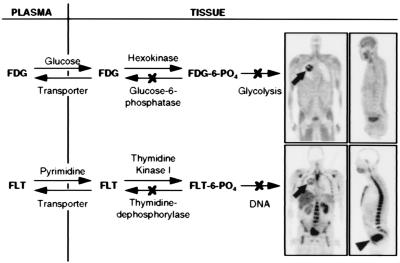
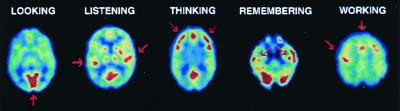
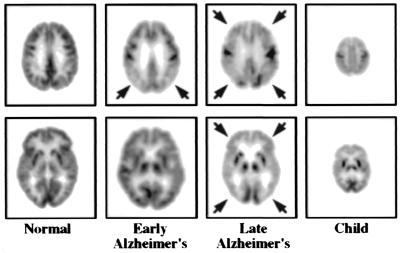
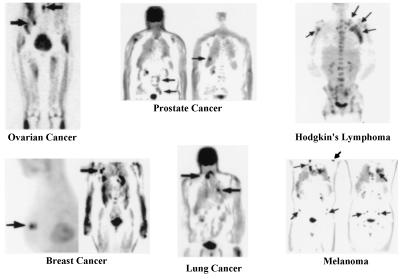
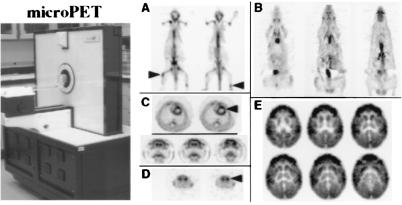
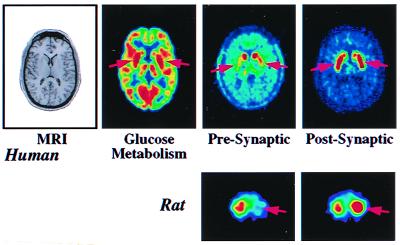
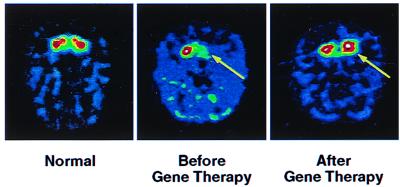
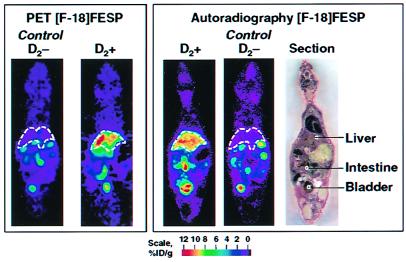
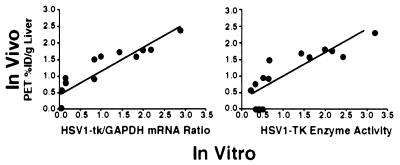
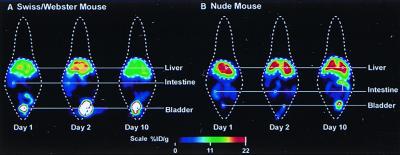
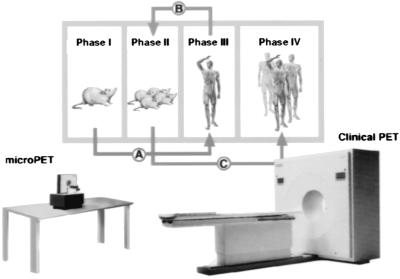
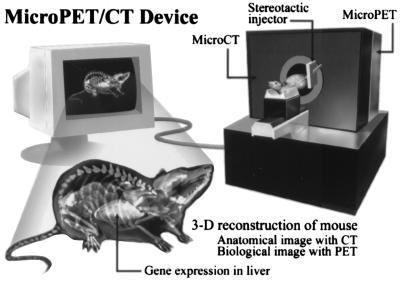
Diseases are biological processes, and molecular imaging with positron emission tomography (PET) is sensitive to and informative of these processes. This is illustrated by detection of biological abnormalities in neurological disorders with no computed tomography or MRI anatomic changes, as well as even before symptoms are expressed. PET whole body imaging in cancer provides the means to (i) identify early disease, (ii) differentiate benign from malignant lesions, (iii) examine all organs for metastases, and (iv) determine therapeutic effectiveness. Diagnostic accuracy of PET is 8-43% higher than conventional procedures and changes treatment in 20-40% of the patients, depending on the clinical question, in lung and colorectal cancers, melanoma, and lymphoma, with similar findings in breast, ovarian, head and neck, and renal cancers. A microPET scanner for mice, in concert with human PET systems, provides a novel technology for molecular imaging assays of metabolism and signal transduction to gene expression, from mice to patients: e.g., PET reporter gene assays are used to trace the location and temporal level of expression of therapeutic and endogenous genes. PET probes and drugs are being developed together-in low mass amounts, as molecular imaging probes to image the function of targets without disturbing them, and in mass amounts to modify the target's function as a drug. Molecular imaging by PET, optical technologies, magnetic resonance imaging, single photon emission tomography, and other technologies are assisting in moving research findings from in vitro biology to in vivo integrative mammalian biology of disease.


Figures

Figure 1
Figure 1
Principles of PET. A biologically active molecule is labeled with a positron emitting radioisotope as in the example FDG. FDG is injected intravenously, distributes throughout the body via bloodstream, and enters into organs, where it traces transport and phosphorylation of glucose. Positrons emitted from the nucleus of F-18 are antielectrons that travel a short distance and combine with an electron, and annihilation occurs with their masses converted into their energy equivalent (E = mc2) through emission of two 511-keV photons 180° apart. The two 511-keV photons are electronically detected as a coincidence event when they strike opposing detectors simultaneously. The figure illustrates one line of coincidence detection, but in an actual tomograph, 6–70 million detector pair combinations record events from many different angles around subject simultaneously. After correction for photon attenuation, tomographic images of tissue concentration are reconstructed. “Blocks” of detectors are arranged around the circumference, with each containing 32–64 detector elements, for a total of tens of thousands of elements. PET scanners provide hundreds of tomographic image planes of either selected organ or entire body. A single 6-mm-thick longitudinal section is shown from a woman with metastasis bilaterally to lung (arrow) from previously treated ovarian cancer. Black is highest metabolic rate in image. Human PET scanner resolution is about 5–6 mm in all three dimensions. Reprinted with permission from ref. .
Figure 2
Figure 2
Tracer kinetic models for FDG and FLT. Arrows show forward and reverse transport between plasma and tissue, phosphorylation and dephosphorylation. Both FDG and FLT phosphates are not significant substrates for dephosphorylation or further metabolism at normal imaging times of 40–60 min after injection. Models taking dephosphorylation reaction into account at much later imaging times have been developed (7, 9). Images are 6-mm-thick longitudinal tomographic sections of a patient with a lung tumor (arrows), with high glucose metabolism and DNA replication. The rest of the images show normal distribution of glucose utilization and DNA replication, exceptions being clearance of both tracers to bladder (arrowhead) and, in the case of FLT, the glucuronidation by hepatocytes (12) in liver.
Figure 3
Figure 3
PET studies of glucose metabolism to map human brain's response in performing different tasks. Subjects looking at a visual scene activated visual cortex (arrow), listening to a mystery story with language and music activated left and right auditory cortices (arrows), counting backwards from 100 by sevens activated frontal cortex (arrows), recalling previously learned objects activated hippocampus bilaterally (arrows), and touching thumb to fingers of right hand activated left motor cortex and supplementary motor system (arrows). Images are cross-sections with front of brain at top. Highest metabolic rates are in red, with lower values from yellow to blue.
Figure 4
Figure 4
PET study of glucose metabolism in Alzheimer's disease. The “early Alzheimer's” is at stage of “questionable Alzheimer's disease” and illustrates characteristic metabolic deficits in parietal cortex (arrows) of the brain. In “late Alzheimer's,” metabolic deficit has spread throughout areas of cortex (arrows), sparing subcortical (e.g., internal) structures (bottom image), and primary motor and sensory areas, such as visual (bottom image) and motor cortices (top image). At late stage disease, metabolic function in Alzheimer's is similar to that of newborn, shown to the far right, which underlies their similar behavior and functional capacity. MRI studies were normal. Reprinted with permission from ref. .
Figure 5
Figure 5
PET images of glucose metabolism in various types of cancers. Study illustrates that increased glycolysis is a common property of cancer, independent of organ of origin. In breast example, a 6-mm lesion is just behind a 10-mm one. Mammogram was normal, and tumor had high expression of HER-2/neu oncogene. Arrows point to some tumors (32). Reprinted with permission from ref. .
Figure 6
Figure 6
Image quality of microPET I. (A) Two 1.5-mm-thick longitudinal whole body sections of a 25-g mouse using [F-18]fluoride ion to image skeletal system of prostate cancer mouse model with bone metastases (arrows). (B) Longitudinal whole body FDG images of glucose metabolism in normal 250-g rat. (C Upper) Cross sections through chest of rat showing glucose metabolism in left (arrow) and right ventricles. Left ventricle is 9 mm in diameter, with 1-mm wall thickness. Right ventricle is thinner, and metabolic rate is 1/3 left. (Lower) Coronal sections of glucose metabolism in rat brain weighing 1 g, showing cortex well separated from internal structure of striatum. (D) Images of mouse brain with [C-11]WIN 35,428 that binds to dopamine reuptake transporters showing clear separation of left and right striatum (arrow) that each weigh about 12 mg. (E) FDG brain images of two-month-old Vervet monkey with good delineation of cortical and subcortical structures. Dimension across brain is 2 cm. Cortical convolutions of brain are not seen because the young monkey has few of them. Reprinted with permission from ref. .
Figure 7
Figure 7
microPET study of whisker stimulation in rat. Whiskers on right side of face were stroked after i.v. injection of FDG. Image shows increased metabolic response (arrow) in areas of cortex receiving inputs from whiskers. Modified from ref. .
Figure 8
Figure 8
Images of patient with early Parkinson's disease and rat model of Parkinson's. (Upper) MRI shows there is no structural abnormality in the brain of patient. PET image of glucose metabolism shows hypermetabolic abnormality of putamen (arrows) with 10% increase over normal value. Image of presynaptic synthesis of dopamine with [F-18]fluorodopa shows a 70% reduction (arrows) whereas image of postsynaptic D2 receptors with the ligand, [F-18]fluoroethylspiperone, shows 15% elevation (up-regulation) of receptors in putamen, in an attempt to compensate for loss of presynaptic dopamine. (Lower) MicroPET images of 6-hydroxydopamine unilateral lesion in rat model of Parkinson's. Image of presynaptic dopamine transporter with [C-11]WIN 35425 shows 60% reduction on lesioned side (arrow) whereas postsynaptic D2 receptors imaged with ligand [C-11]raclopride show compensatory up-regulation of receptors (arrow) in the striatum. Opposite striatum is a control. Modified from ref. .
Figure 9
Figure 9
Imaging gene therapy with PET in unilateral MPTP monkey model of Parkinson's. Dopamine synthesis was imaged with aromatic amino acid decarboxylase substrate, meta-[F-18]fluorotyrosine. (Left) Image of normal dopamine synthesis in caudate and putamen. (Center) Image shows unilateral dopamine MPTP-induced deficit (arrow) before gene therapy. (Right) Image shows restoration of dopamine synthesis (arrow) after gene therapy. Figure courtesy of K. Baukiewicz.
Figure 10
Figure 10
Illustration of PRG/PRP for imaging gene expression. Viruses containing reporter and therapy genes are intravenously injected and localize gene transfer to liver. PRG is transcribed to mRNA and translated to a protein product that is the target of the PRP after injected into a tail vein.
Figure 11
Figure 11
microPET and autoradiography studies of PRG/PRP imaging of gene expression in the same mouse. PRG is D2 receptor, and PRP is FESP. (Left) MicroPET image of a single 1.5-mm-thick longitudinal section of living control mouse negative for D2 receptor (D2) PRG, showing no significant retention of PRP in liver (dashed lines). In animal carrying dopamine receptor reporter gene (D2+), there is retention of FESP PET reporter probe in liver reflecting gene expression. Images were taken 50 min after injection of FESP and 2 days after virus administration. (Right) After microPET imaging, animals were killed, sectioned, and imaged with autoradiography. Photograph of section is at far right. Color scales represent percent injected dose of PRP per gram (% ID/g) of tissue, with red the highest value (51). Reprinted with permission from ref. .
Figure 12
Figure 12
Comparison of gene expression measured in vivo with microPET to direct in vitro measures of HSV1-tk mRNA and HSV1-TK enzyme activity in liver tissue (42).
Figure 13
Figure 13
Repeated imaging of gene expression in the same mouse. The PRG is a point-mutated HSV1-tk optimized for ganciclovir and penciclovir. PRG is FPCV. The combination of the point mutation and FPCV provides a signal-to-noise improvement of 6 over HSV1-tk and FGCV. The Swiss/Webster mouse is a wild type, and the nude mouse has immature immune system. % ID is percent injected dose of FPCV per gram of tissue.
Figure 14
Figure 14
Model approach for discovery and evaluation process for molecular imaging probes and drugs. Modified from ref. .
Figure 15
Figure 15
Design concept of small animal scanner with PET and x-ray CT combined into a single device. A stereotactic injector is attached to device for local organ injections of cells, viruses, and drugs, as well as tissue sampling for direct biochemical analysis. Reprinted with permission from ref. .

References

    1. Phelps M, Hoffman E, Mullani N, TerPogossian M. J Nucl Med. 1975;16:210–224. - PubMed
    1. Phelps M, Hoffman E, Mullani N, Higgins C, TerPogossian M. IEEE Trans Biomed Eng. 1976;NS-23:516–522.
    1. Hoffman E, Phelps M, Mullani N, Higgins C, TerPogossian M. J Nucl Med. 1976;17:493–502. - PubMed
    1. Cho Z, Chan J, Eriksson L. IEEE Trans Nucl Sci. 1976;NS-23:613–622.
    1. Derenzo S, Budinger T, Cahoon J. IEEE Nucl Sci. 1977;NS-24:544–558.

Publication types

LinkOut - more resources