. 2000 Sep;67(3):549-62.
doi: 10.1086/303056. Epub 2000 Aug 4.

Iron-dependent self-assembly of recombinant yeast frataxin: implications for Friedreich ataxia

Affiliations

Iron-dependent self-assembly of recombinant yeast frataxin: implications for Friedreich ataxia

J Adamec et al. Am J Hum Genet. 2000 Sep.

Abstract

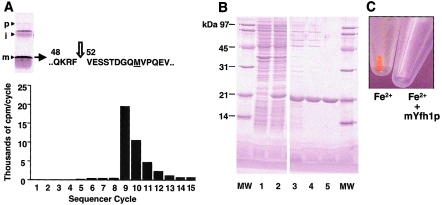
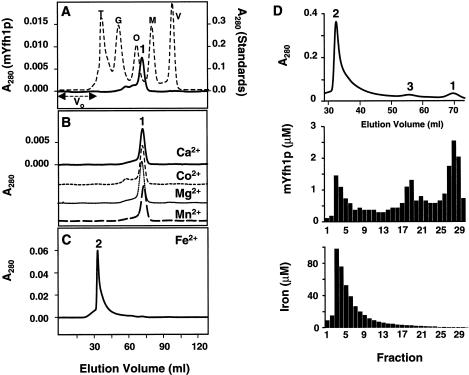
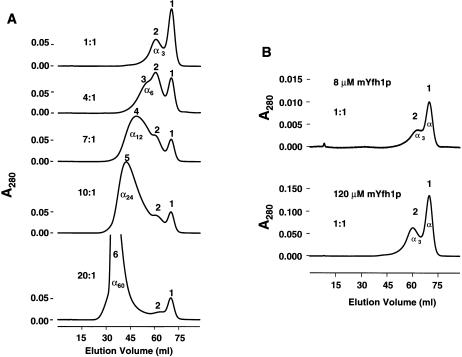
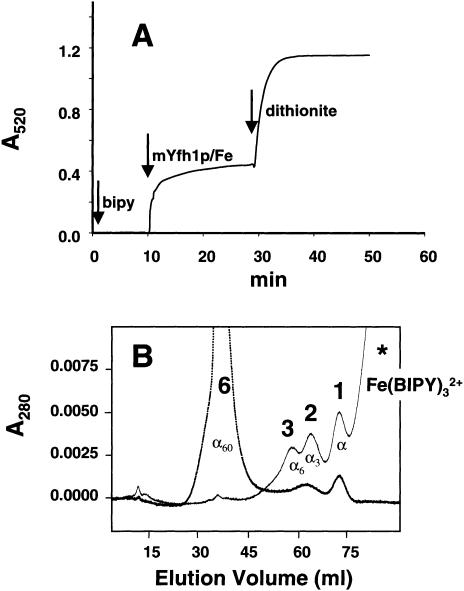
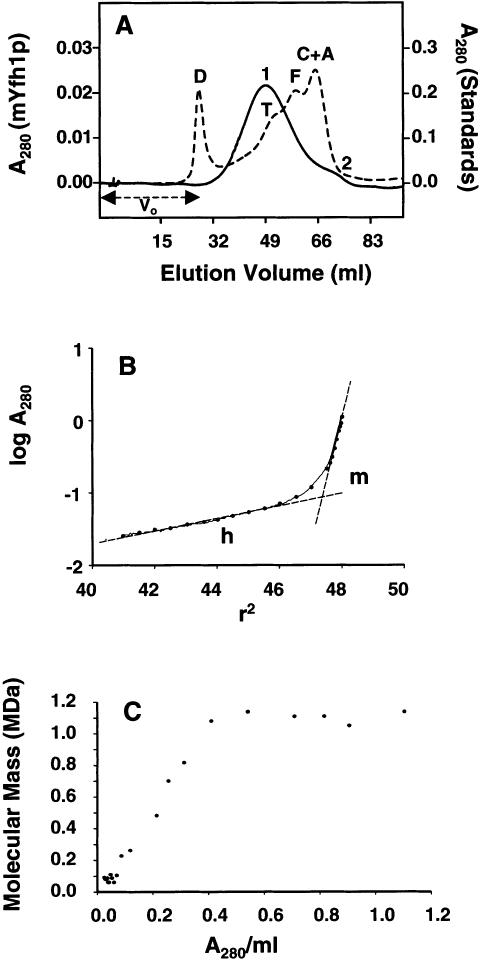
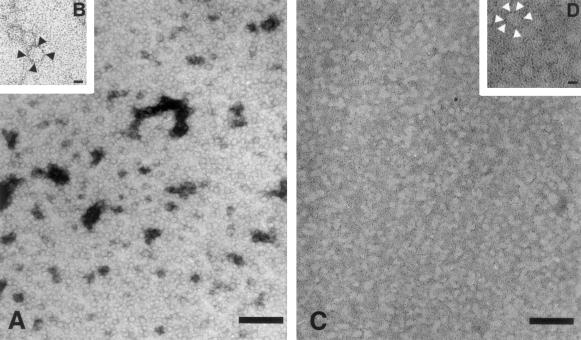
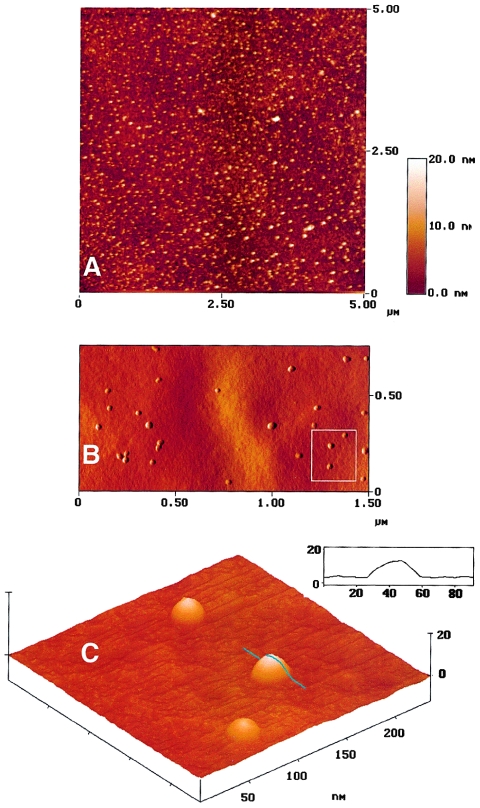
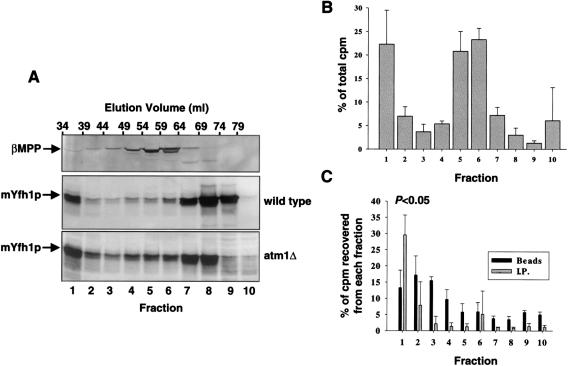
Frataxin deficiency is the primary cause of Friedreich ataxia (FRDA), an autosomal recessive cardiodegenerative and neurodegenerative disease. Frataxin is a nuclear-encoded mitochondrial protein that is widely conserved among eukaryotes. Genetic inactivation of the yeast frataxin homologue (Yfh1p) results in mitochondrial iron accumulation and hypersensitivity to oxidative stress. Increased iron deposition and evidence of oxidative damage have also been observed in cardiac tissue and cultured fibroblasts from patients with FRDA. These findings indicate that frataxin is essential for mitochondrial iron homeostasis and protection from iron-induced formation of free radicals. The functional mechanism of frataxin, however, is still unknown. We have expressed the mature form of Yfh1p (mYfh1p) in Escherichia coli and have analyzed its function in vitro. Isolated mYfh1p is a soluble monomer (13,783 Da) that contains no iron and shows no significant tendency to self-associate. Aerobic addition of ferrous iron to mYfh1p results in assembly of regular spherical multimers with a molecular mass of approximately 1. 1 MDa (megadaltons) and a diameter of 13+/-2 nm. Each multimer consists of approximately 60 subunits and can sequester >3,000 atoms of iron. Titration of mYfh1p with increasing iron concentrations supports a stepwise mechanism of multimer assembly. Sequential addition of an iron chelator and a reducing agent results in quantitative iron release with concomitant disassembly of the multimer, indicating that mYfh1p sequesters iron in an available form. In yeast mitochondria, native mYfh1p exists as monomer and a higher-order species with a molecular weight >600,000. After addition of (55)Fe to the medium, immunoprecipitates of this species contain >16 atoms of (55)Fe per molecule of mYfh1p. We propose that iron-dependent self-assembly of recombinant mYfh1p reflects a physiological role for frataxin in mitochondrial iron sequestration and bioavailability.


Figures

Figure  1
Figure 1
Production of recombinant mYfh1p. A, N-terminal radiosequencing of mYfh1p. Top, Two-step processing of Yfh1p by purified MPP, with “p,” “i,” and “m” denoting the precursor, intermediate, and mature forms of Yfh1p, as analyzed by 12% SDS/PAGE (Branda et al. 1999). A methionine residue (underlined) was substituted for valine 60 downstream of the predicted second MPP cleavage site to provide a radioactive marker, and [35S]methionine-pYfh1p(V60M) precursor was incubated with recombinant yeast MPP (Branda et al. 1999). Processing products were separated by SDS/PAGE, were electroblotted onto a polyvinylidene difluoride membrane, and were detected by autoradiography. The mYfh1p band was excised and applied directly on a PE/ABD Procise 494-HS sequencer, and 100% of each fraction was collected and was analyzed by scintillation counting (Matsudaira 1987). Valine 52 marks the N-terminus of mYfh1p, as determined by the release of [35S]methionine in cycle 9; note that, in the following cycles, the cpm decreased by ∼50% until reaching the level of background measured before cycle 9, as a result of insufficient washing of the cartridge and the line to the fraction collector. The identified cleavage site, RF↓VE, matches the consensus, Rx↓(S/x), found at many MPP cleavage sites (Gavel and von Heijne 1990). B, Overexpression and purification of mYfh1p. Aliquots of different fractions were analyzed by 12% SDS/PAGE and SYPRO Orange (Molecular Probes) staining. MW = MW marker proteins (1 μg protein/band). Lanes 1–2 show bacterial lysate (20 μg) before and after induction, respectively; lane 3, Macro-Prep DEAE pool (9 μg); lane 4, UNO Q1 pool (4.5 μg); and lane 5, Superdex 200 pool (4 μg). C, Isolated mYfh1p maintains iron in a soluble form. A 320-μM solution of Fe(NH4)2(SO4)2 in 10 mM HEPES-KOH, pH 7.4, was incubated for 1 h at 30°C in the absence or presence of 8 μM mYfh1p. Both samples were centrifuged at 14,000 × g for 5 min, and the supernatants were removed before photography.
Figure  2
Figure 2
Iron induces self-assembly of mYfh1p. A, Purified mYfh1p (total protein 110 μg; final concentration 8 μM) was incubated in a final volume of 1 ml HEPES buffer for 1 h at 30°C, and the sample was centrifuged at 14,000 × g for 5 min and was immediately applied to a Superdex 200 column. V0 = void volume. The elution profile of isolated mYfh1p is superimposed on that of MW standards (broken line). V = vitamin B12 (1.4 kDa); M = myoglobin (17 kDa); O = ovalbumin (44 kDa); G = gammaglobulin (158 kDa); T = thyroglobulin (669 kDa). B, Conditions were the same as those described for panel A, except that mYfh1p was incubated in the presence of 320 μM CaCl2, CoCl2, MgCl2, or MnCl2. The four chromatograms are superimposed. The A280 scale is shown only for the top chromatogram. C, Conditions were the same as those described for panel A, except that the incubation step was performed in the presence of 320 μM Fe(NH4)2(SO4)2. Note that most of the A280 of peak 2 is accounted for by the absorbance of ferric oxides (ε280=160,000 M−1 cm−1), rather than the absorbance of mYfh1p (ε280=20,000 M−1 cm−1). D, Conditions were the same as those described for panel C, except that 440 μg total protein (final concentration 8 μM) were used; the relevant portion of the chromatogram is shown (top). Middle, Protein concentration in the eluted fractions was analyzed by 12% SDS/PAGE, followed by staining with SYPRO Orange and densitometry in a Storm 840 Optical Scanner using the ImageQuant software package (Molecular Dynamics); a known amount (as determined by quantitative amino acid analysis) of purified mYfh1p was used as the internal standard. Bottom, Iron concentration was determined in the eluted fractions by ICP.
Figure  3
Figure 3
Iron-dependent stepwise assembly of mYfh1p. A, Fixed amount of mYfh1p (final concentration 120 μM [15-fold higher than that which was used in fig. 2CD]) was incubated with increasing concentrations of Fe(NH4)2(SO4)2 to obtain the Fe:mYfh1p ratios indicated. Each sample was separately analyzed on the Superdex 200 column. B, As described for panel A, except that two different concentrations of mYfh1p were used.
Figure  4
Figure 4
Iron release from mYfh1p. A, Chelator BIPY was loaded anaerobically into a Cary 1 spectrophotometer, and the absorbance was zeroed at 520 nm (left arrow). The reaction was started by anaerobic addition of Fe-mYfh1p (middle arrow [at 10 min]), and A520/time was measured until the absorbance reached a constant value. An anaerobic solution of sodium dithionite was added at 30 min (right arrow), and measurements of A520/time were continued until a new constant value was reached. B, Immediately afterward, the untreated and BIPY/dithionite-treated aliquots (80 μg total protein each) were separately analyzed on the Superdex 200 column.
Figure  5
Figure 5
Gel filtration and sedimentation equilibrium analyses of Fe-mYfh1p. A, Experimental conditions were the same as those described in the legend for figure 2C, except that the sample was applied to a Superose 6 column. The elution profile of mYfh1p (unbroken line) is superimposed on that of MW standards (broken line). A = aldolase (158 kDa); C = catalase (232 kDa); F = ferritin (440 kDa); T = thyroglobulin (669 kDa); D = blue dextran 2,000 (2 MDa). B, Isolated mYfh1p was incubated with Fe(NH4)2(SO4)2, and the sample was subjected to sedimentation equilibrium analysis as described in the Material and Methods section. The plot of log A280 versus r2 is shown. The presence of at least two different macromolecular species (multimer [m] and hexamer [h]) is deduced from two linear-fit lines. The slopes formula image correspond to m=1.64 and h=0.08. The equation formula image × formula imageformula image (Williams et al. 1958) was used to calculate the MW of the multimer and the hexamer. formula image cm3/g, calculated from the amino acid composition of mYfh1p, was used for h, and formula image cm3/g, including also 50 equivalents of FeO, was used for m. C, The molecular mass was also calculated at 22 different log A280/r2 increments (blackened circles in panel B) and was plotted versus the averaged A280/ml. The m form, which accounts for ∼75% of the total A280, is denoted by the six blackened symbols at 1.1 MDa, and the h form, which accounts for ∼8% of the A280, is denoted by the cluster of blackened symbols at 0.1 MDa.
Figure  6
Figure 6
Electron microscopy of isolated Fe-mYfh1p multimers. Multimers were prepared and were isolated by gel filtration as described in the Material and Methods section. Aliquots were subjected to negative staining with 0.5% uranyl acetate (A and B), or they were simply dried on a grid and analyzed without further preparation (C and D). The initial magnification was ×50,000. In panels A and C, the bar = 100 nm, whereas in panels B and D, the bar = 10 nm.
Figure  7
Figure 7
AFM of isolated Fe-mYfh1p multimers. The sample analyzed in figure 6C and D was viewed by AFM as described in the Material and Methods section. A, AFM image over an area of 5 × 5 μm. The height range is indicated by the inset. Three-dimensional AFM reconstruction from the top (B) and from a pitch angle of 33 degrees (C) are shown, and the procedure for measurement of width and height is illustrated by the profile of one particle (C, inset).
Figure  8
Figure 8
Detection of high-MW Fe-mYfh1p in vivo. A, Detergent extracts of isolated wild-type or atm1Δ mitochondria (∼3 mg total protein in each case) were fractionated on a Superdex 200 column, and the eluted fractions were analyzed by western blotting. After detection of mYfh1p, the wild-type membrane was reprobed with a polyclonal antibody against β-MPP. B and C, Mitochondrial extracts were prepared from atm1Δ cells grown in the presence of 55FeCl3 and were fractionated on a Superdex 200 column as described above. B, The cpm of each fraction were measured by scintillation counting and expressed as the percentage of the total cpm recovered in the 10 fractions analyzed (0.8-1.6×10⁶ cpm); the bars denote the means ± SD of three experiments. C, Fractions were pretreated with 100 μl protein A-Sepharose (beads), after which the supernatants (after removal of the beads) were incubated with anti-Yfh1p antibodies and immunocomplexes precipitated with another 100 μl protein A-Sepharose (I.P.). The cpm associated with the beads and I.P. pellets are expressed as the percentage of the total cpm in the corresponding fraction. The mean ± SD of three experiments is shown.

Similar articles

Cited by

References

Electronic-Database Information

    1. GenBank, http://www.ncbi.nlm.nih.gov/Genbank/index.html (for YFH1 [accession number Z74168])
    1. Online Mendelian Inheritance in Man (OMIM), http://www.ncbi.nlm.nih.gov/Omim/ (for FRDA [MIM 229300]) - PubMed

References

    1. Babcock M, de Silva D, Oaks R, Davis-Kaplan S, Jiralerspong S, Montermini L, Pandolfo M, Kaplan J (1997) Regulation of mitochondrial iron accumulation by Yfh1p, a putative homologue of frataxin. Science 276:1709–1712 - PubMed
    1. Bradley JL, Blake JC, Chamberlain S, Thomas PK, Cooper JM, Schapira AH (2000) Clinical, biochemical and molecular genetic correlations in Friedreich’s ataxia. Hum Mol Genet 9:275–282 - PubMed
    1. Branda SS, Cavadini P, Adamec J, Kalousek F, Taroni F, Isaya G (1999) Yeast and human frataxin are processed to mature form in two sequential steps by the mitochondrial processing peptidase. J Biol Chem 274:22763–22769 - PubMed
    1. Campuzano V, Montermini L, Lutz Y, Cova L, Hindelang C, Jiralerspong S, Trottier Y, Kish SJ, Faucheux B, Trouillas P, Authier FJ, Durr A, Mandel JL, Vescovi A, Pandolfo M, Koenig M (1997) Frataxin is reduced in Friedreich ataxia patients and is associated with mitochondrial membranes. Hum Mol Genet 6:1771–1780 - PubMed
    1. Campuzano V, Montermini L, Molto MD, Pianese L, Cossee M, Cavalcanti F, Monros E, et al (1996) Friedreich’s ataxia: autosomal recessive disease caused by an intronic GAA triplet repeat expansion. Science 271:1423–1427 - PubMed

Publication types

MeSH terms

Associated data