. 2000 Aug;106(3):373-84.
doi: 10.1172/JCI8273.

Insulin restores neuronal nitric oxide synthase expression and function that is lost in diabetic gastropathy

Affiliations

Insulin restores neuronal nitric oxide synthase expression and function that is lost in diabetic gastropathy

C C Watkins et al. J Clin Invest. 2000 Aug.

Erratum in

Abstract

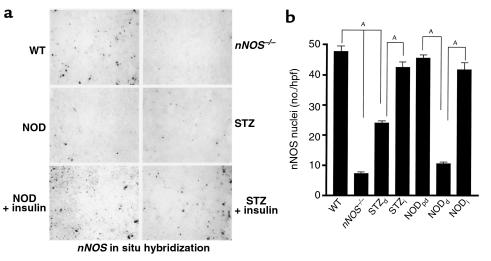
Gastrointestinal dysfunction is common in diabetic patients. In genetic (nonobese diabetic) and toxin-elicited (streptozotocin) models of diabetes in mice, we demonstrate defects in gastric emptying and nonadrenergic, noncholinergic relaxation of pyloric muscle, which resemble defects in mice harboring a deletion of the neuronal nitric oxide synthase gene (nNOS). The diabetic mice manifest pronounced reduction in pyloric nNOS protein and mRNA. The decline of nNOS in diabetic mice does not result from loss of myenteric neurons. nNOS expression and pyloric function are restored to normal levels by insulin treatment. Thus diabetic gastropathy in mice reflects an insulin-sensitive reversible loss of nNOS. In diabetic animals, delayed gastric emptying can be reversed with a phosphodiesterase inhibitor, sildenafil. These findings have implications for novel therapeutic approaches and may clarify the etiology of diabetic gastropathy.


Figures

Figure 1
Figure 1
nNOS–/– mice have delayed gastric emptying and loss of NO-dependent NANC relaxation. Gastric emptying in (a) wild-type (WT) mice and (b) nNOS–/– mice. As described in Methods, phenol red–labeled saline (circles), 10% dextrose (triangles), or 20% dextrose (squares) was instilled into the stomachs of groups of mice, five to ten animals for each time point. The mice were sacrificed at the indicated times to determine the fraction of phenol red remaining in the stomachs as a measure of gastric emptying. Individual data points represent the mean (± SEM) for five to 10 determinations at each time point derived from groups of individual mice. In some instances, the error bars are small and contained within the symbol. The delay in gastric emptying observed in response to increased caloric content is consistent with known gastric physiology and is preserved in nNOS–/– mice. (c) EFS-evoked NANC relaxations were monitored from wild-type and nNOS–/– pylori as described (see Methods). After precontraction with SP (0.1 μM), wild-type pylori demonstrate relaxation (> 95%) in response to EFS (40 V, 10 Hz, 5 ms pulse for a duration of 5 seconds), whereas relaxation is nearly absent in nNOS–/– pylori (< 5%). All EFS-evoked relaxations were blocked with 0.1 μM TTX and the nNOS inhibitors L-NNA (0.1 mM) and 7-NI (0.1 mM). The examples shown are from a representative experiment. (d) Quantification of NANC-induced relaxations in response to EFS for wild-type and nNOS–/– pylori. Several pylori representing wild-type and nNOS–/– mice were used to quantitatively analyze the degree of NANC relaxation in response to EFS. Data shown are the means (± SEM) of several determinations for each group of mice (n = 20 for wild-type and 10 for nNOS–/– pylori). AP < 0.01 compared with wild-type specimens.
Figure 2
Figure 2
Diabetic mice have delayed gastric emptying that is not due to hyperglycemia and enlarged stomachs. (a) Gastric emptying (20% dextrose) in diabetic mice. NOD-prediabetic mice (filled circles), age 10 weeks, have gastric emptying rates similar to wild-type mice (filled squares). STZ-diabetic mice (open triangles) and NOD-diabetic mice (open circles) exhibit significantly delayed gastric emptying, similar to that of nNOS–/– mice (filled triangles). Each data point represents the mean (± SEM) from groups of four to six animals. All diabetic animals exhibit some delay in gastric emptying, and this is reflected in the error bars (SEM) as shown. In some instances, the error bars are small and contained within the symbols. This experiment has been repeated twice with the same results. (b) Serum glucose levels of STZ-diabetic mice after insulin treatment. STZ-diabetic mice were either sham operated (n = 5) or treated with subcutaneous placement of an insulin-releasing implant (n = 5; see Methods). Then, serum glucose levels were determined at the indicated time points. The data shown are the means (± SEM) of five measurements for each time point. Serum glucose levels decline to around 100 mg/dL by 12 hours and remain at similar levels for 48 hours. (c) Gastric emptying in STZ-diabetic mice after 12 hours of insulin treatment. STZ-diabetic mice were either sham operated (STZd(s)) or treated with subcutaneous placement of an insulin-releasing implant (STZd(ii)) 12 hours before determination of gastric emptying. The data shown are the means (± SEM) for five to seven measurements per time point. (d) Stomachs excised from wild-type, NOD-prediabetic (NODpd), nNOS–/–, NOD-diabetic (NODd), and STZ-diabetic (STZd) mice were photographed to demonstrate the enlargement of the stomach in NOD-diabetic mice. The pictures are representative of five to eight specimens examined for each group of animals. (e) Stomachs from wild-type, NOD-prediabetic, nNOS–/–, NOD-diabetic, and STZ-diabetic mice were weighed after fasting for 4 hours. Data shown are the means (± SEM) for five specimens in each group. The stomachs from the NOD-diabetic and nNOS–/– mice weighed significantly more than those from wild-type mice. AP < 0.05 for nNOS–/– stomachs compared with wild-type and for NOD-diabetic specimens compared with NOD-prediabetic.
Figure 3
Figure 3
Pylori from diabetic mice lack NO-mediated NANC relaxation: reversal by insulin treatment. (a) EFS-evoked NO-mediated NANC relaxations are substantially reduced at 2, 5, and 10 Hz in nNOS–/– pylori compared with wild-type pylori. NOD-prediabetic pylori resembled the wild-type mice with maximal relaxation at 10 Hz. NOD-diabetic pylori have nearly absent NANC relaxation at 2, 5, and 10 Hz, resembling that of nNOS–/– pylori, whereas insulin treatment (1 week) of NOD-diabetic animals partially restores NANC relaxation. NANC relaxations in pylori from STZ-diabetic mice are significantly reduced, similar to pylori from nNOS–/– mice, and insulin treatment (1 week) of STZ-diabetic animals restores NANC relaxation. In control experiments, we compared responses of wild-type pylori to EFS stimulation as 2, 5, and 10 Hz or in the reverse order 10, 5, and 2 Hz, and we observed no apparent differences. The results shown are representative samples of five to ten pyloric preparations from different animals. (b) Quantification of NANC relaxation in response to EFS in diabetic pylori. Several pylori, representing the indicated groups of mice, were used to quantitatively analyze the degree of NANC relaxation in response to EFS. Data shown are the means (± SEM) of several determinations for each group of mice: n = 10 for wild-type; n = 8 for nNOS–/–; n = 5 for NOD-prediabetic; n = 5 for NOD-diabetic; n = 8 for STZ-diabetic; n = 5 for insulin-treated NOD-diabetic (NODi); and n = 8 for insulin-treated STZ-diabetic (STZi). AP < 0.01 for nNOS–/– and STZ-diabetic compared with wild-type specimens, for NOD-diabetic compared with NOD-prediabetic specimens, for insulin-treated NOD-diabetic specimens compared with NOD-diabetic specimens, and for insulin-treated STZ-diabetic specimens compared with STZ-diabetic samples.
Figure 4
Figure 4
nNOS protein expression in the pyloric myenteric neurons is depleted in diabetic mice: reversal by insulin treatment. (a) Immunohistochemical analysis of nNOS protein expression. nNOS is present in wild-type but not nNOS–/– pyloric myenteric neurons, whereas nNOS expression is lost in both NOD-diabetic and STZ-diabetic mice. Insulin treatment (1 week) of NOD-diabetic and STZ-diabetic animals reverses the loss of nNOS expression. (b) Quantification of nNOS protein expression. The number of nNOS-expressing neurons per hpf (×40) was determined, for ten microscopic fields, for each group of animals, with SEM as shown by the error bars. These results have been obtained in two separate experiments with four to six mice per group. AP < 0.01 for nNOS–/– and STZ-diabetic samples compared with wild-type samples, for NOD-diabetic compared with NOD-prediabetic samples, for insulin-treated NOD-diabetic compared with NOD-diabetic samples, and for insulin-treated STZ-diabetic compared with STZ-diabetic specimens.
Figure 5
Figure 5
nNOS mRNA expression in the pyloric myenteric neurons is depleted in diabetic mice: reversal by insulin treatment. (a) In situ hybridization analysis of nNOS expression. nNOS mRNA expression is present in wild-type and depleted nNOS–/– pyloric myenteric neurons, whereas nNOS mRNA expression is significantly decreased in both NOD-diabetic and STZ-diabetic mice. (b) Quantification of nNOS mRNA expression. The number of positive nuclei for nNOS mRNA per hpf was determined for ten microscopic fields, for each treatment group, with SEM as shown by the error bars. These results have been obtained in two separate experiments with four to six mice per group. AP < 0.01 for nNOS–/– and STZ-diabetic samples compared with wild-type samples, for NOD-diabetic compared with NOD-prediabetic samples, for insulin-treated NOD-diabetic compared with NOD-diabetic samples, and for insulin-treated STZ-diabetic compared with STZ-diabetic specimens.
Figure 6
Figure 6
nNOS protein is depleted throughout the intestine in NOD mice: reversal by insulin. Western blot analysis of nNOS protein expression was performed using samples from several regions of intestine derived from NOD-prediabetic, NOD-diabetic, and insulin-treated NOD-diabetic mice. nNOS protein is nearly completely depleted in the pylorus, esophagus, and ileum, with only partial depletion in other intestinal regions. There is no apparent change in nNOS expression in the brain. Insulin treatment (1 week) completely reverses the loss of nNOS protein. The results are shown in duplicate and are representative of six animals analyzed for each group.
Figure 7
Figure 7
Pylori of diabetic mice have a loss of nNOS expression without a loss of neurons. Myenteric neurons were quantified by counting the number of positive neurons per hpf. No change in expression of SYN, MAP2, or VIP was observed for either STZ-diabetic or NOD-diabetic mice. The data shown are the means (± SEM) of determinations from at least ten microscopic fields, with the experimenter blinded to the treatment condition of the animals from which the histological sections were derived.
Figure 8
Figure 8
PDE5 inhibition reverses delayed gastric emptying in diabetic mice. NOD-diabetic and STZ-diabetic mice were treated with sildenafil (sf), as described in Methods, 20 minutes before determining gastric emptying. The data shown are the means (± SEM) of quadruplicate determinations representing four animals for each data point. Sildenafil treatment of diabetic animals reverses delayed gastric emptying in diabetic animals.
Figure 9
Figure 9
Insulin treatment reverses delayed gastric emptying. (a) Insulin treatment (1 week) of STZ-diabetic and NOD-diabetic mice reverses delayed gastric emptying (20% dextrose). The data shown are the means (± SEM) of quadruplicate determinations representing four animals for each data point. (b) Inhibition of nNOS with 7-NI delays gastric emptying in insulin-treated diabetic mice. Diabetic mice were treated with insulin (1 week) and subsequently treated with the nNOS inhibitor 7-NI (50 mg/kg) as described in Methods. Gastric emptying was measured, and mice were sacrificed at 30 minutes. Data shown are means (± SEM) of five determinations reflecting five animals in each group. AP < 0.01 for 7-NI–injected, insulin-treated NOD-diabetic animals compared with insulin-treated NOD-diabetic mice and for 7-NI–injected, insulin-treated STZ-diabetic animals compared with insulin-treated STZ-diabetic animals.

References

    1. Porte, D., Jr., and Halter, J.B. 1999. The clinical syndrome of diabetes mellitus. In Diabetic neuropathy. P.J. Dyck and P.K. Thomas, editors. W.B. Saunders Co. Philadelphia, Pennsylvania, USA. 1–28.
    1. Foster, D.W. 1998. Diabetes mellitus. In Harrison’s principles of internal medicine. A.S. Fauci et al., editors. McGraw-Hill. New York, New York, USA. 2060–2081.
    1. Feldman M, Schiller LR. Disorders of gastrointestinal motility associated with diabetes mellitus. Ann Intern Med. 1983;98:378–384. - PubMed
    1. Abrahamsson H. Gastrointestinal motility disorders in patients with diabetes mellitus. J Intern Med. 1995;237:403–409. - PubMed
    1. Koch KL. Diabetic gastropathy: gastric neuromuscular dysfunction in diabetes mellitus: a review of symptoms, pathophysiology, and treatment. Dig Dis Sci. 1999;44:1061–1075. - PubMed

Publication types

MeSH terms