. 2000 Aug;11(8):2553-63.
doi: 10.1091/mbc.11.8.2553.

Analysis of cortical flow models in vivo

Affiliations
Free PMC article

Analysis of cortical flow models in vivo

H A Benink et al. Mol Biol Cell. 2000 Aug.
Free PMC article

Abstract

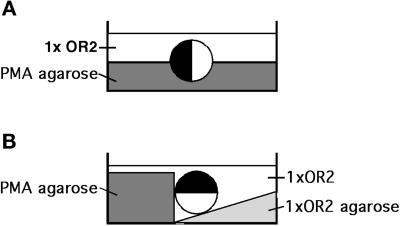
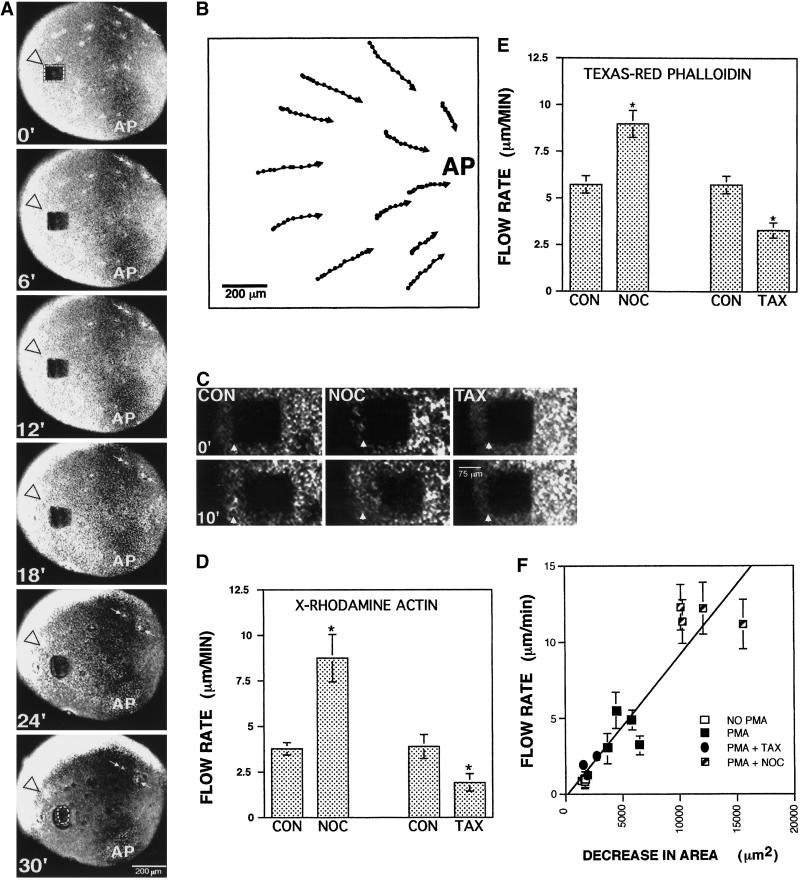
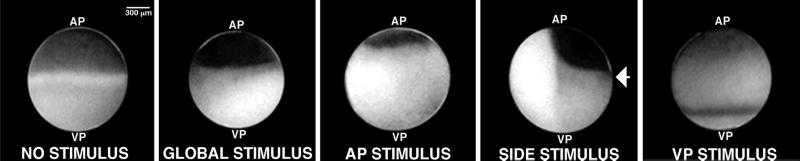
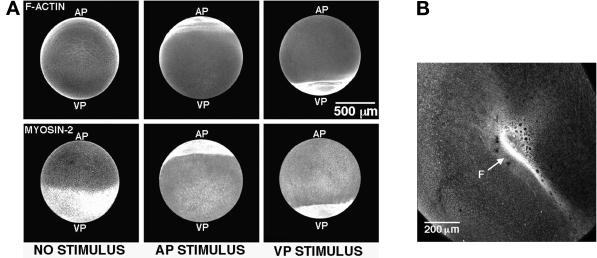
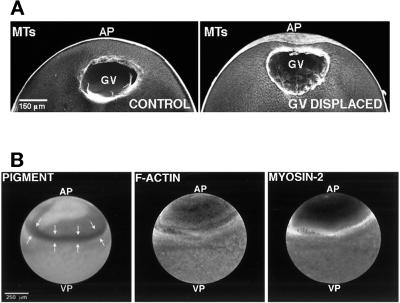
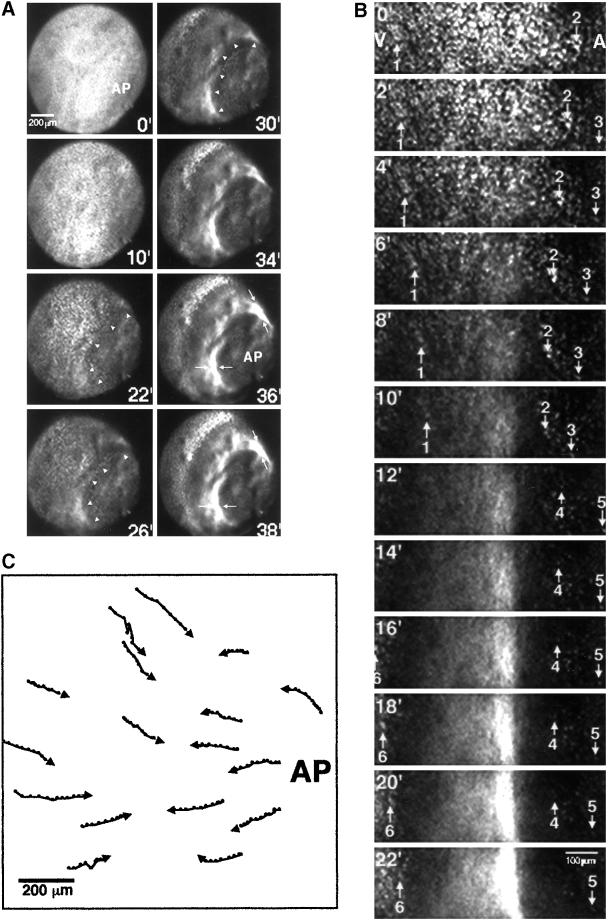
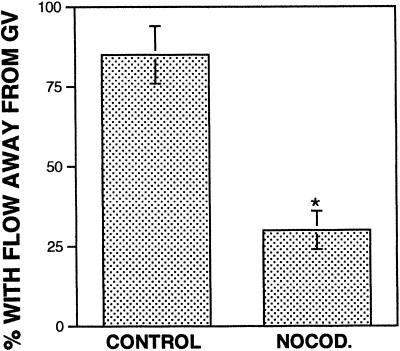
Cortical flow, the directed movement of cortical F-actin and cortical organelles, is a basic cellular motility process. Microtubules are thought to somehow direct cortical flow, but whether they do so by stimulating or inhibiting contraction of the cortical actin cytoskeleton is the subject of debate. Treatment of Xenopus oocytes with phorbol 12-myristate 13-acetate (PMA) triggers cortical flow toward the animal pole of the oocyte; this flow is suppressed by microtubules. To determine how this suppression occurs and whether it can control the direction of cortical flow, oocytes were subjected to localized manipulation of either the contractile stimulus (PMA) or microtubules. Localized PMA application resulted in redirection of cortical flow toward the site of application, as judged by movement of cortical pigment granules, cortical F-actin, and cortical myosin-2A. Such redirected flow was accelerated by microtubule depolymerization, showing that the suppression of cortical flow by microtubules is independent of the direction of flow. Direct observation of cortical F-actin by time-lapse confocal analysis in combination with photobleaching showed that cortical flow is driven by contraction of the cortical F-actin network and that microtubules suppress this contraction. The oocyte germinal vesicle serves as a microtubule organizing center in Xenopus oocytes; experimental displacement of the germinal vesicle toward the animal pole resulted in localized flow away from the animal pole. The results show that 1) cortical flow is directed toward areas of localized contraction of the cortical F-actin cytoskeleton; 2) microtubules suppress cortical flow by inhibiting contraction of the cortical F-actin cytoskeleton; and 3) localized, microtubule-dependent suppression of actomyosin-based contraction can control the direction of cortical flow. We discuss these findings in light of current models of cortical flow.


Figures

Figure 1
Figure 1
Schemes showing the methods by which cortical flow was redirected and ectopic furrows were induced. (A) Method used to redirect cortical flow. The oocyte (shown on its side) is positioned in a bed of PMA-containing agarose such that approximately half of the oocyte surface is in contact with PMA. (B) Method used to induce ectopic furrows. The oocyte is positioned and held against PMA-containing agarose with the slope of agarose lacking PMA such that only a very localized area on the oocyte surface is in contact with PMA.
Figure 4
Figure 4
Microtubules suppress contraction of the cortical F-actin network and flow of cortical F-actin. (A) Low-magnification 4D microscopy analysis of an oocyte injected with X-rhodamine–actin showing the flow of cortical F-actin to the animal pole (AP) of an oocyte bathed in PMA. The dark square (outlined with a dashed line) is a photobleached area that moves toward the animal pole over time. The arrowhead indicates the original position of the upper left corner of the photobleached area. Individual accumulations of cortical F-actin (arrows) can also be seen to move toward the animal pole over time. (B) Vector diagram showing the paths of 12 individual F-actin aggregates over time in an oocyte induced to undergo animal pole–directed cortical flow by global treatment with PMA. Aggregate positions were determined every 2 min. All aggregates flow toward the animal pole. (C) Higher-magnification 4D views of photobleached area movement in control oocytes (CON), oocytes treated with nocodazole (NOC), and oocytes treated with taxol (TAX). Arrowheads indicate the initial starting position of the lower left corner of the photobleached area. Movement of the photobleached area is fastest in nocodazole-treated oocytes and slowest in taxol-treated oocytes. (D) Quantification of F-actin cortical flow rates as determined by 4D analysis of oocytes injected with X-rhodamine–actin and then subjected to microtubule manipulations. Nocodazole more than doubles the rate of F-actin cortical flow, whereas taxol reduces the rate by slightly more than half. Results represent means ± SEM of four independent experiments. The asterisk indicates a p value < 0.05. (E) Quantification of F-actin cortical flow rates as determined by 4D analysis of oocytes injected with Texas Red–X-phalloidin and then subjected to microtubule manipulations. Nocodazole nearly doubles the rate of F-actin cortical flow, whereas taxol reduces the rate by slightly less than half. Results represent means ± SEM of four independent experiments. The asterisk indicates a p value < 0.05. (F) Microtubules suppress contraction of the cortical F-actin network. Rates of F-actin cortical flow plotted versus shrinkage of photobleached areas in oocytes injected with X-rhodamine–actin and then subjected to no treatment (NO PMA), PMA treatment (PMA), PMA treatment after a taxol pretreatment (PMA + TAX), or PMA treatment after a nocodazole pretreatment (PMA + NOC). The rate of cortical flow is proportional to the shrinkage of photobleached areas. PMA plus nocodazole treatment results in increased shrinkage of photobleached areas relative to PMA alone, whereas PMA plus taxol treatment results in decreased shrinkage relative to PMA alone. Virtually no shrinkage (and no cortical flow) is observed in the absence of PMA. Each data point is from a different oocyte; error bars represent means ± SEM of five different cortical flow rate measurements taken for each oocyte.
Figure 2
Figure 2
Localized contractile stimulus redirects the flow of cortical pigment granules toward the site of application. Controls show pigmentation before the addition of PMA (no stimulus) and the preprogrammed cortical flow of pigment granules resulting from global application of PMA (global stimulus). In oocytes subjected to the localized application of PMA to the animal pole region (AP stimulus), the side (side stimulus; applied on the right side of the oocyte), and the vegetal pole region (VP stimulus), cortical flow is revealed by the movement of pigment granules toward the region of stimulus.
Figure 3
Figure 3
Distribution of F-actin and myosin-2 after redirected flow. (A) Cortical F-actin and myosin-2 accumulate at sites of localized contractile stimulus. Confocal fluorescence images of F-actin stained with Texas Red–X-phalloidin and immunolabeled myosin-2 in oocytes that have undergone redirected cortical flow. In contrast to controls (no stimulus), oocytes that were positioned with either their animal poles (AP stimulus) or vegetal poles (VP stimulus) facing the PMA-containing agarose show an enrichment of both F-actin and myosin-2 at the animal pole or vegetal pole, respectively. (B) Confocal fluorescence image of an ectopic furrow on an oocyte stained with Texas Red–X-phalloidin. The furrow (F) is rich in F-actin.
Figure 5
Figure 5
Redirection of cortical flow by GV displacement. (A) Displacement of the oocyte GV toward the animal pole (AP). Confocal immunofluorescence micrographs of microtubule distribution in a control oocyte and an oocyte subjected to displacement of the GV toward the animal pole before the induction of cortical flow. The GV and its associated microtubules (MTs) are in closer proximity to the animal pole in the oocyte subjected to GV displacement. (B) Cortical pigment, F-actin, and myosin-2 distribution after cortical flow in an oocyte with a displaced GV. Cortical pigment granules, F-actin, and myosin-2 are sparse in the area of the animal pole (AP) toward which the GV was displaced. Instead, they accumulate in a ring positioned between the equator and the animal pole of the oocyte. VP, vegetal pole.
Figure 6
Figure 6
Circumferential rings of F-actin form in oocytes with displaced GVs as a result of convergent cortical flow. (A) Low-magnification 4D analysis of an oocyte injected with Texas Red–X-phalloidin, subjected to GV displacement, and then induced to undergo cortical flow by global treatment with PMA. Initially, F-actin is uniformly distributed throughout the oocyte cortex. After the onset of cortical flow, an F-actin–poor region (the borders of which are indicated by arrowheads) is evident in the region of the animal pole (AP) to which the GV has been displaced. F-actin continues to accumulate at the borders of this region until it is visible as an intense, linear array that encircles the oocyte. (B) High-magnification 4D analysis of convergent cortical flow from the same oocyte shown in A. Six individual F-actin accumulations (indicated by numbers and arrows) flow toward each other as a result of cortical flow away from the vegetal pole (the direction of which is indicated by a V) or away from the animal pole (the direction of which is indicated by an A). Over time, this convergent cortical flow gives rise to an intense, linear accumulation of cortical F-actin. (C) Vector diagram showing the paths of 17 individual F-actin aggregates over time in an oocyte subjected to GV displacement and then induced to undergo cortical flow by global treatment with PMA. Aggregate positions were determined every 2 min. Aggregates in the vegetal hemisphere flow toward the animal pole, whereas aggregates near the animal pole (AP) flow away from the animal pole.
Figure 7
Figure 7
Cortical flow away from displaced GVs is microtubule-dependent. Oocytes were subjected to GV displacement toward the animal pole and then induced to undergo cortical flow in the absence (CONTROL) or presence (NOCOD.) of nocodazole. Redirected cortical flow was judged by observing oocyte pigmentation. Nocodazole significantly reduced the number of oocytes exhibiting cortical flow away from the newly positioned GV. Results are means ± SEM from three independent experiments. The asterisk indicates a p value < 0.05.

Similar articles

Cited by

References

    1. Bement WM. Signal transduction by calcium and protein kinase C during egg activation. J Exp Zool. 1992;263:382–397. - PubMed
    1. Bement WM, Capco DG. Activators of protein kinase C trigger cortical granule exocytosis, cortical contraction, and cleavage furrow formation in Xenopus laevis oocytes and eggs. J Cell Biol. 1989;108:885–892. - PMC - PubMed
    1. Bement WM, Mandato CA, Kirsch MN. Wound-induced assembly and closure of an actomyosin purse string in Xenopus oocytes. Curr Biol. 1999;9:579–587. - PubMed
    1. Bershadsky A, Chausovsky A, Becker E, Lyubimova A, Geiger B. Involvement of microtubules in the control of adhesion-dependent signal transduction. Curr Biol. 1996;6:1279–1289. - PubMed
    1. Bluemink JG. Cortical wound healing in the amphibian egg. J Ultrastruct Res. 1972;41:95–114. - PubMed

Publication types

MeSH terms

LinkOut - more resources