. 2000 Aug;11(8):2803-20.
doi: 10.1091/mbc.11.8.2803.

The internal phosphodiesterase RegA is essential for the suppression of lateral pseudopods during Dictyostelium chemotaxis

Affiliations
Free PMC article

The internal phosphodiesterase RegA is essential for the suppression of lateral pseudopods during Dictyostelium chemotaxis

D J Wessels et al. Mol Biol Cell. 2000 Aug.
Free PMC article

Abstract

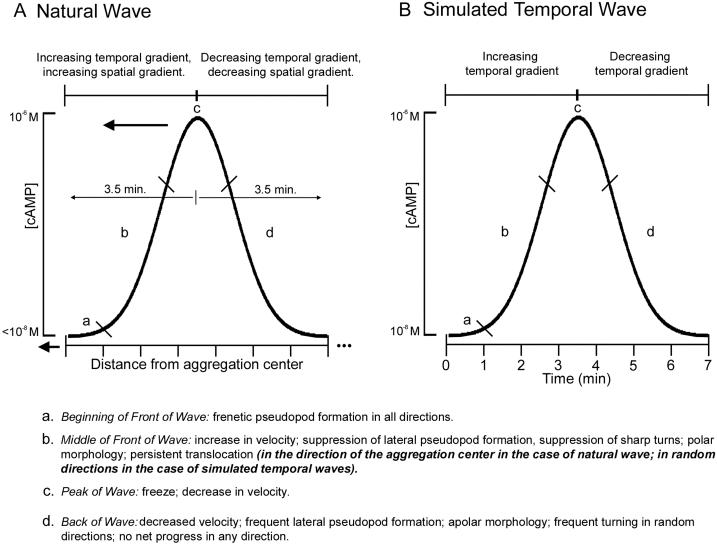
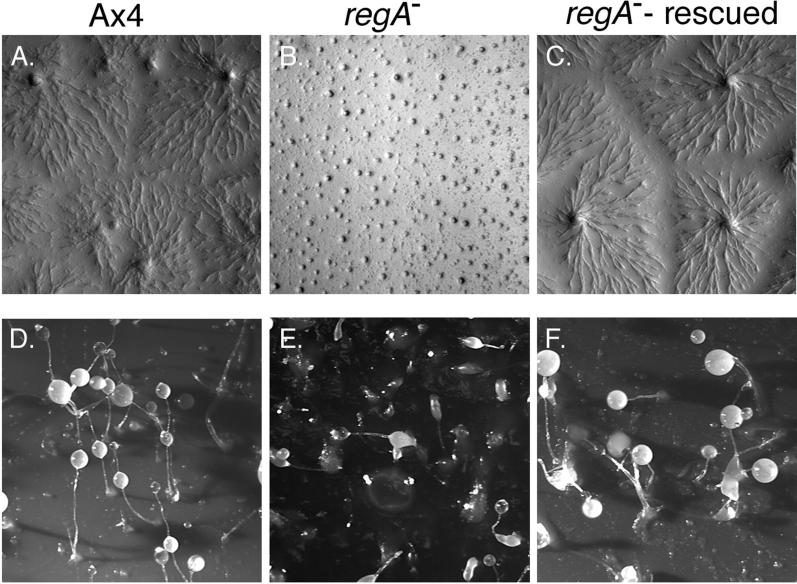
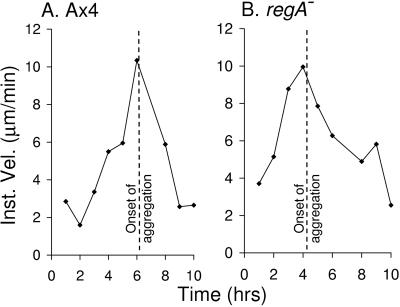
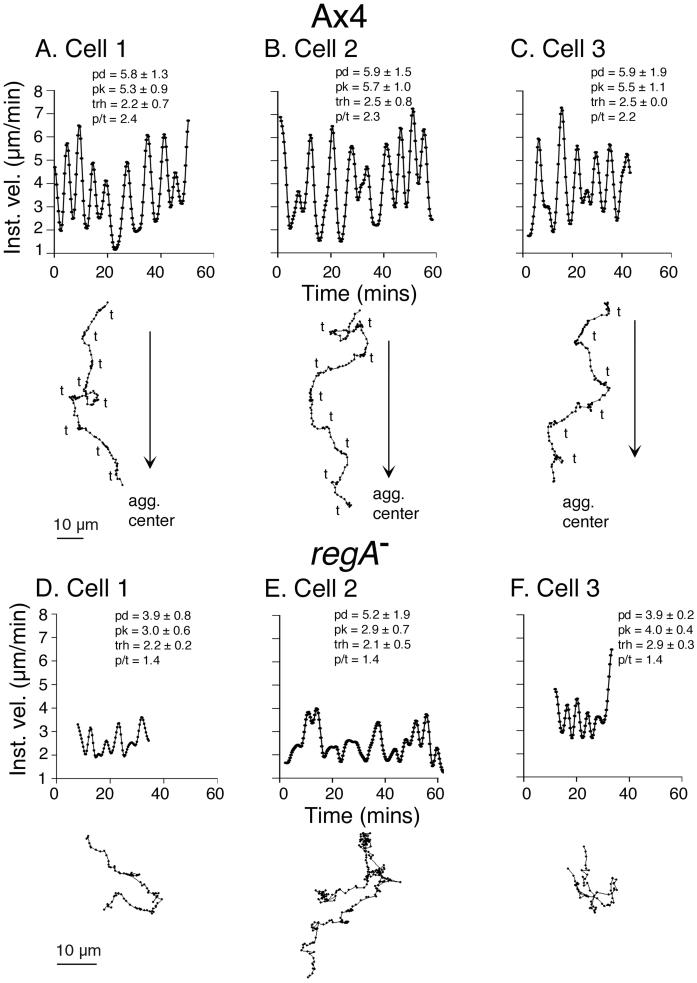
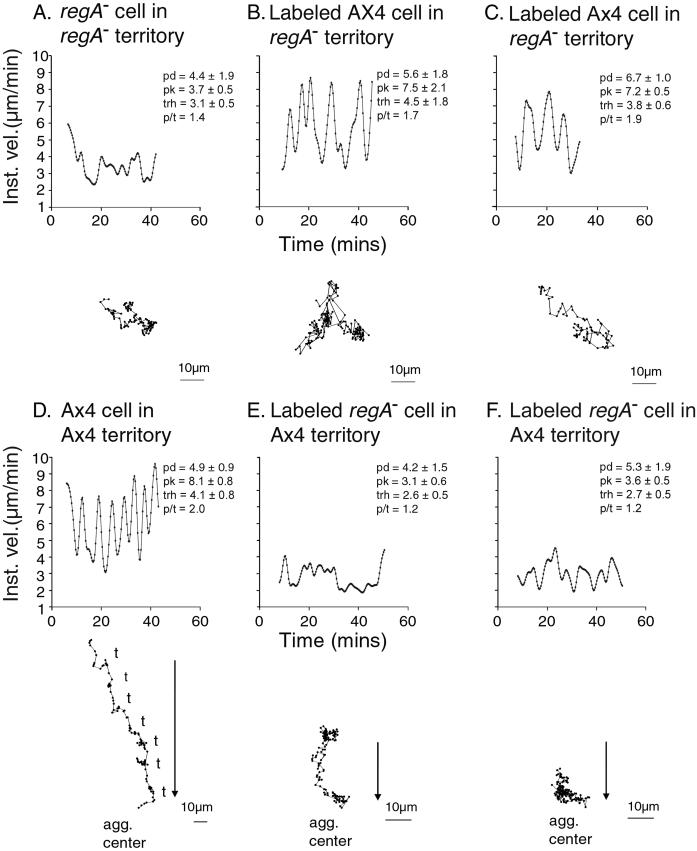
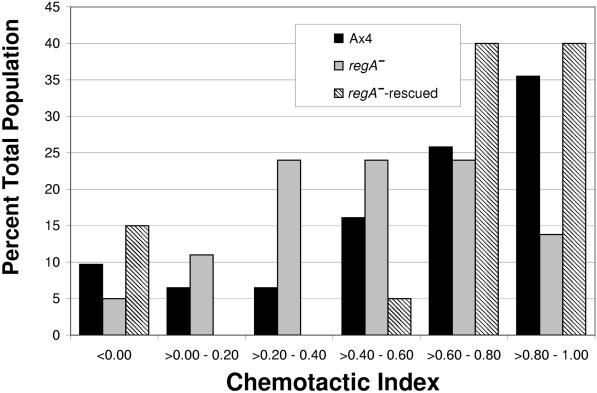
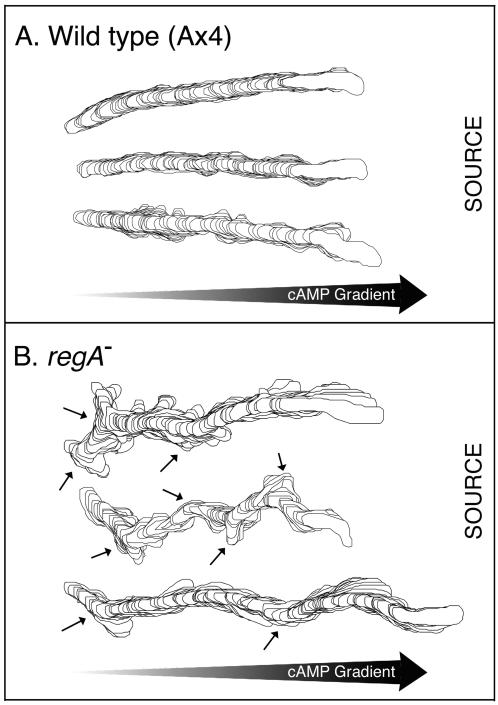
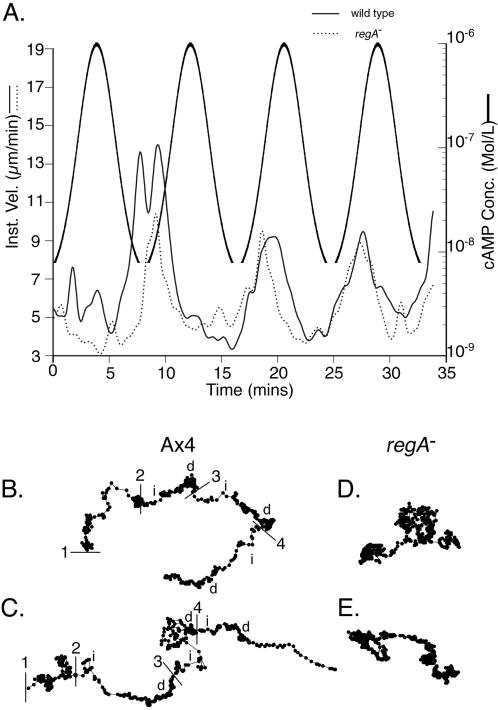
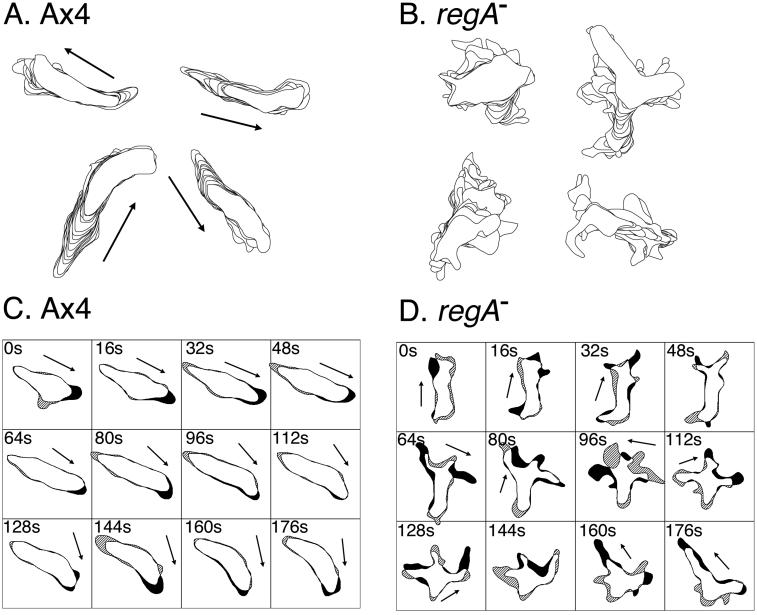
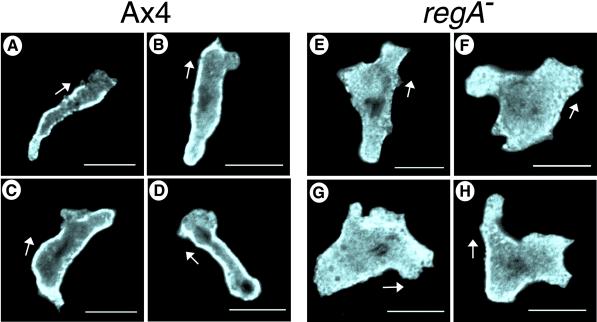
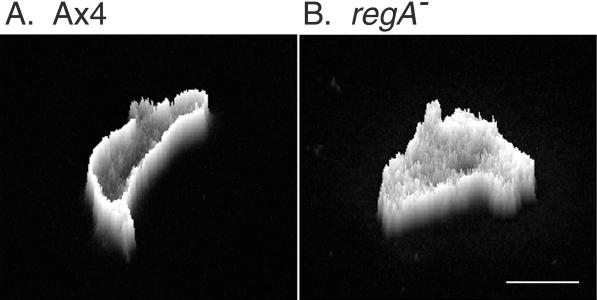
Dictyostelium strains in which the gene encoding the cytoplasmic cAMP phosphodiesterase RegA is inactivated form small aggregates. This defect was corrected by introducing copies of the wild-type regA gene, indicating that the defect was solely the consequence of the loss of the phosphodiesterase. Using a computer-assisted motion analysis system, regA(-) mutant cells were found to show little sense of direction during aggregation. When labeled wild-type cells were followed in a field of aggregating regA(-) cells, they also failed to move in an orderly direction, indicating that signaling was impaired in mutant cell cultures. However, when labeled regA(-) cells were followed in a field of aggregating wild-type cells, they again failed to move in an orderly manner, primarily in the deduced fronts of waves, indicating that the chemotactic response was also impaired. Since wild-type cells must assess both the increasing spatial gradient and the increasing temporal gradient of cAMP in the front of a natural wave, the behavior of regA(-) cells was motion analyzed first in simulated temporal waves in the absence of spatial gradients and then was analyzed in spatial gradients in the absence of temporal waves. Our results demonstrate that RegA is involved neither in assessing the direction of a spatial gradient of cAMP nor in distinguishing between increasing and decreasing temporal gradients of cAMP. However, RegA is essential for specifically suppressing lateral pseudopod formation during the response to an increasing temporal gradient of cAMP, a necessary component of natural chemotaxis. We discuss the possibility that RegA functions in a network that regulates myosin phosphorylation by controlling internal cAMP levels, and, in support of that hypothesis, we demonstrate that myosin II does not localize in a normal manner to the cortex of regA(-) cells in an increasing temporal gradient of cAMP.


Figures

Figure 1
Figure 1
The behavior of a cell in the different portions of a natural cAMP wave propagated in a population of developing Dictyostelium discoideum amoebae (A) and in a temporal wave of cAMP generated in a perfusion chamber in the absence of a spatial gradient of cAMP (B). The cyclic behavior of cells responding to natural waves of cAMP is similar to that of cells responding to the different portions of a simulated wave (a, b, c, and d) in all aspects but one. While cells in the front of a natural wave all move in a persistent manner in the same direction (i.e., toward the aggregation center, the source of the wave), cells in the front of a simulated temporal wave move in a persistent manner in all directions. From the similar cyclic pattern of behaviors, the portions of the natural wave were deduced from the known portions of the in vitro generated temporal wave (Wessels et al., 1992). The heavy arrow in (A) indicates the direction of spreading of the nondissipating, relayed natural wave. The bold print in point b refers to the one difference between the behavior in a natural wave and the behavior in a simulated temporal.
Figure 2
Figure 2
The late aggregation territories (A–C) and fruiting bodies (D–F) of Ax4, regA, and regA-rescued cell cultures, respectively. Note the abnormally small size (B) as well as the absence of streams (B) and the incomplete or small fruiting bodies (E) in regA cultures. Note the reexpression of normal traits, including large aggregates and streaming (C) and large fruiting bodies (F) in regA-rescued cultures.
Figure 3
Figure 3
Motility is developmentally regulated in regA cells (B) as it is in parental Ax4 cells (A). Cells were removed from the respective developing cultures at the noted intervals, were dispersed on the wall of a perfusion chamber, and average instantaneous velocity were measured over a 10-min period. The mean instantaneous velocity at each time point was computed from the average instantaneous velocities of 20 amoebae at each time point.
Figure 4
Figure 4
Time plots of instantaneous velocity and corresponding centroid tracks of three representative Ax4 cells (A–C) and three representative regA cells (D–F) responding to natural waves generated in their own homogeneous aggregation territories. Arrows along Ax4 centroid tracks represent the direction toward the common aggregation center (source of waves), and “t” represents the trough regions in the respective velocity plots. In regA territories, there was no single direction reflecting the source of the wave, hence no arrows have been included in panels D–F. Pd, average period between velocity peaks; pk, average peak velocity; trh, average trough velocity; p/t, ratio of average peak to average trough velocities. Values are presented as average ± SD. Velocity plots were smoothed 10 times with Tukey windows of 10, 20, 40, 20, and 10.
Figure 5
Figure 5
The behavior of a representative unlabeled regA cell (A) and two DiI-labeled Ax4 cells (B and C) in the same area of a developing regA culture, and the behavior of a representative unlabeled Ax4 cell (D) and two DiI-labeled regA cells (E and F) in the same Ax4 aggregation territory. Arrows in (D–F) indicate the direction toward the aggregation center (the source of waves) of the territory in which the three representative cells are located. pd, pk, trh, and p/t and the smoothing regime are described in the legend to Figure 3.
Figure 6
Figure 6
Histogram of CIs indicates that regA cells are less efficient at attaining high-end CIs (i.e., >0.80–1.00) than either Ax4 or regA-rescued cells.
Figure 7
Figure 7
Computer-generated tracks of the three analyzed Ax4 cells and the three analyzed regA cells in a spatial gradient of cAMP exhibiting the highest chemotactic indices. Small arrows in (B) point to turns initiated by lateral pseudopods.
Figure 8
Figure 8
The behavior of Ax4 and regA cells in temporal gradients of cAMP generated in the absence of spatial gradients that mimic the temporal dynamics of natural waves of cAMP. (A) The average instantaneous velocity and estimated cAMP concentration are shown during simulated waves. Note that neither Ax4 nor regA cells increase instantaneous velocity in the front of the first simulated wave (Varnum et al., 1985). Instantaneous velocity, measured at 1-min intervals, represents the average of 10 Ax4 cells and 10 regA cells, respectively. (B and C) The centroid tracks of Ax4 cells responding to sequential simulated temporal waves of cAMP. (D and E) The centroid tracks of regA cells responding to sequential simulated temporal waves of cAMP. 1, 2, 3, and 4 (in B and C), sequential wave number; i, increasing gradient; d, decreasing gradient. Velocity plots in (A) were smoothed 10 times with Tukey windows of 10, 20, 40, 20, and 10.
Figure 9
Figure 9
Behavior of Ax4 and regA cells in the first 3 min of the increasing phase of a temporal wave of cAMP that mimics the temporal dynamics of a natural wave of cAMP. (A and B) Perimeter tracks of Ax4 and regA cells, respectively. (C and D) Difference pictures of a representative Ax4 and regA cell, respectively. Black filled areas represent expansion zones, and hatched areas represent contraction zones of difference pictures. Arrows in difference pictures represent direction vectors drawn through the centroids of the earlier and later perimeter image in each difference picture.
Figure 10
Figure 10
Mysoin II distribution in representative Ax4 cells (A–D) and regA cells (E–H) midway in the front of a simulated temporal wave of cAMP (the third in a series). Images were taken 0.4 μm off the substratum, using identical confocal scanning parameters for comparison. Small arrows indicate the polarity of the cell interpreted from the parallel DIC image of each cell. The scale bar represents 10 μm.
Figure 11
Figure 11
A “pseudo-3D” projection in which the z-axis represents the intensity distribution of stained myosin II over the scanned area of a representative Ax4 (Figure 10C) and a representative regA cell (Figure 10G) midway in the front of a simulated temporal wave of cAMP. Scale bar represents 10 μm.

Similar articles

Cited by

References

    1. Alcantara F, Monk M. Signal propagation during aggregation in the slime mold Dictyostelium discoideum. J Gen Microbiol. 1974;85:321–334. - PubMed
    1. Aubry L, Firtel RA. Integration of signaling networks that regulate Dictyostelium differentiation. Annu Rev Cell Dev Biol. 1999;15:469–517. - PubMed
    1. Chang WT, Thomason PA, Gross JD, Newell PC. Evidence that the RdeA protein is a component of a multistep phosphorelay modulating rate of development in Dictyostelium. EMBO J. 1998;17:2809–2816. - PMC - PubMed
    1. Chung CY, Firtel RA. PAKa, a putative PAK family member, is required for cytokinesis and the regulation of the cytoskeleton in Dictyostelium discoideum cells during chemotaxis. J Cell Biol. 1999;147:559–575. - PMC - PubMed
    1. Cocucci S, Sussman M. RNA in cytoplasmic and nuclear fractions of cellular slime mold amoebae. J Cell Biol. 1970;45:399–407. - PMC - PubMed

Publication types

LinkOut - more resources