Comparative Study
. 2000 Aug 7;150(3):447-60.
doi: 10.1083/jcb.150.3.447.

Visualization of tRNA movements on the Escherichia coli 70S ribosome during the elongation cycle

Affiliations
Comparative Study

Visualization of tRNA movements on the Escherichia coli 70S ribosome during the elongation cycle

R K Agrawal et al. J Cell Biol. .

Abstract

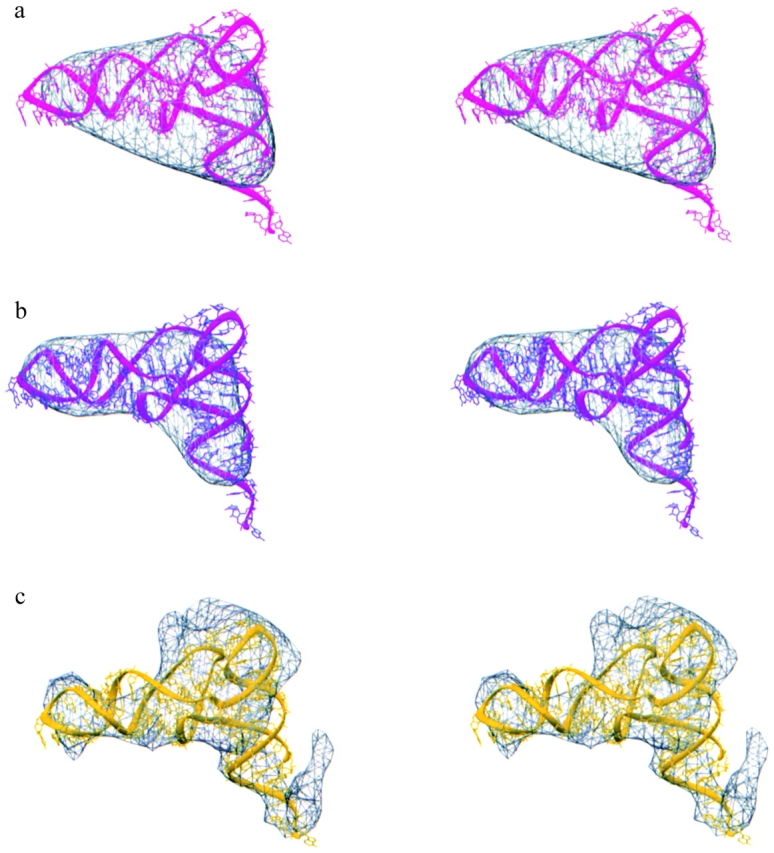
Three-dimensional cryomaps have been reconstructed for tRNA-ribosome complexes in pre- and posttranslocational states at 17-A resolution. The positions of tRNAs in the A and P sites in the pretranslocational complexes and in the P and E sites in the posttranslocational complexes have been determined. Of these, the P-site tRNA position is the same as seen earlier in the initiation-like fMet-tRNA(f)(Met)-ribosome complex, where it was visualized with high accuracy. Now, the positions of the A- and E-site tRNAs are determined with similar accuracy. The positions of the CCA end of the tRNAs at the A site are different before and after peptide bond formation. The relative positions of anticodons of P- and E-site tRNAs in the posttranslocational state are such that a codon-anticodon interaction at the E site appears feasible.


Figures

Figure 1
Figure 1
3D maps of the PRE (a; with Phe-tRNAPhe at the A site) and the POST (b; with dipeptidyl tRNA at the P site) complexes shown in top view, with the 30S subunit below the 50S subunit. c and d, The ribosome cut open, by removing the portions of head and central protuberance of the 30S and the 50S subunits, respectively, to expose the intersubunit space where tRNAs bind. The A-, P-, and E-site tRNA masses can be seen directly. c, The PRE complex as shown in a. d, The POST complex as shown in b. The PRE complex also shows an unexpected mass corresponding to the E-site tRNA on the L1 protein side, which is due to the binding of deacylated tRNA in a fraction of PRE complex. CP, central protuberance; L1, L1 protein; St, L7/L12-stalk base, where protein L11 complexed with 58-nt 23S RNA fragment has been located in an earlier study (Gabashvili et al. 2000); h, head; pt, platform; sp, spur.
Figure 2
Figure 2
Difference maps, obtained by subtracting the 3D map of the fMet-tRNAf Met–70S ribosome complex (Malhotra et al. 1998) from those of the two PRE complexes, superimposed on the 15-Å resolution map of the ribosome (semitransparent blue). The ribosome is shown in a top view, with the 30S subunit below the 50S subunit. a, PRE complex containing Phe-tRNAPhe (pink) at the A site and deacylated tRNAPhe (green) at the P site, i.e., corresponding to the PRE complex shown in Fig. 1 c. b, PRE complex containing dipeptidyl tRNA (fMet-Phe-tRNAPhe; violet) at the A site and deacylated tRNAf Met (green) at the P site. c, The two difference maps superimposed with transparent pink. The 70S ribosome is viewed from the 50S-solvent side to indicate the shift in the position of the CCA half of the dipeptidyl tRNA towards the P-site tRNA. d, same as in c, but with the ribosome removed for clarity. The subtracted cryo-EM density corresponding to the P-site tRNA has been pasted in afterwards (green). For this, we have used the density due to fMet-tRNAf Met (Gabashvili et al. 2000), which also carries an additional, inseparable mass on its anticodon end. As pointed out in the text, the mass of densities seen on the L1 side of the P-site tRNA (green) in both PRE complexes could be due to a conformational change in the L1 protein. CP, central protuberance; L1, L1-protein; St, L7/L12-stalk base; h, head; pt, platform; sp, spur.
Figure 3
Figure 3
Difference maps obtained from a poly(U)-programmed ribosome–(tRNAPhe)3 complex (adapted from Agrawal et al. 1999c) showing densities (yellow) corresponding to A, and overlapping P/E-, E-, and E2-site tRNAs. As in Fig. 2, the subtracted cryo-EM density corresponding to the fMet-tRNAf Met has been pasted in afterwards (green). CP, central protuberance; L1, L1 protein; St, L7/L12-stalk base; h, head; pt, platform; sp, spur.
Figure 4
Figure 4
Stereo view representations to show the fitting of the X-ray structure of tRNAPhe into the various difference masses. The difference masses (gray wire-mesh) corresponding to the tRNA positions indicated were derived from the following complexes by applying a 3D spherical mask of 43 Å radius to the corresponding portions of the EM map and difference maps: a, A site (magenta), in the difference mass from the PRE complex containing Phe-tRNAPhe at the A site, as shown in Fig. 2 a; b, APep state (violet), in the difference mass from the PRE complex containing dipeptidyl tRNA (fMet-Phe-tRNAPhe) at the A site, as shown in Fig. 2 b; c, E site (yellow), in the mass from the POST complex map, as shown in Fig. 1b and Fig. d.
Figure 5
Figure 5
Stereo view representations showing the relative positions of tRNAs on the ribosome. a, A- (pink), P- (green), and E- (yellow) site tRNAs, as viewed from the top of the ribosome (ribosome not shown). b, A, APep (violet), and P site. In both representations, the 30S subunit would be below the 50S subunit, as in Fig. 1.
Figure 6
Figure 6
Stereo view representations of the fitted tRNAs placed into the 11.5-Å resolution 3D map of the 70S ribosome (Gabashvili et al. 2000). The crystal structure of tRNAPhe, filtered to 5-Å resolution, was placed into the positions corresponding to A- (pink), P- (green), and E- (yellow) sites. The 70S ribosome is shown as a semitransparent surface, with the 30S subunit (yellow) on the left and the 50S subunit (blue) on the right. a, A- and P-site tRNAs in the PRE state. b, P- and E-site tRNAs in the POST state. lb, Long bridge, identified as helix 38 of the 23S RNA in an earlier study (Gabashvili et al. 2000); sh, shoulder region of the 30S subunit; ch, mRNA channel; CP, central protuberance; L1, L1 protein; St, L7/L12-stalk base; h, head; sp, spur.
Figure 7
Figure 7
Stereo view representations of the tRNA positions on the ribosomal subunits (semitransparent), isolated from the 11.5-Å resolution 3D map of the 70S ribosome (Gabashvili et al. 2000). The ribosomal subunits, 30S (yellow) and 50S (blue), are shown from the subunit–subunit interface side. The crystal structure of tRNAPhe corresponding to A- (pink), APep- (violet), P- (green), E- (yellow), and E2- (brown) site tRNAs was filtered to 5-Å resolution. a, A-, APep-, and P-site tRNAs on the 30S subunit. b, APep-state tRNA and P-site tRNAs on the 50S subunit. The asterisk (*) points to helix 69 of the 23S RNA (see text). c, P- and E-site tRNAs on the 30S subunit. The map has been slightly rotated (as compared with a) to make the mRNA channel visible. d, P-, E-, and E2-site tRNAs on the 50S subunit. The map has been slightly rotated (as compared with b) to show the relative position of anticodon ends in P, E, and E2 sites. The peptidyltransferase center, based on the position of the CCA ends of APep-state and P-site tRNA, has been marked by an asterisk (*). The CCA arm of the tRNA at the E2 site is not shown as its orientation is uncertain (see text). bk, Beak of the 30S subunit head; SRL, α-sarcin/ricin loop region of the 23S RNA; sh, shoulder region of the 30S subunit; ch, mRNA channel; L1, L1 protein; St, L7/L12-stalk base; h, head; pt, platform; sp, spur.
Figure 8
Figure 8
Various inferred positions of the tRNAs, overlaid on the 11.5-Å resolution 3D map of the ribosome to sketch out the elongation cycle. The transparent ribosome is shown in top view, with 30S subunit (yellow) below the 50S subunit (blue). Before entering into the elongation step, the 70S ribosome contains a tRNA (green) in the P site (a; Malhotra et al. 1998; Agrawal et al. 1999c; Gabashvili et al. 2000), which is approached by a ternary complex of aminoacyl-tRNA, EF-Tu, and GTP. The tRNA portion of the unbound ternary complex is presented in gray, the EF-Tu portion in red. The complex binds to the 70S initiation complex (b) in the A/T state (Moazed and Noller 1989a). The binding position of the ternary complex to the ribosome has been obtained from a separate study (Agrawal, R.K., N. Burkhardt, R.A. Grassucci, K.H. Nierhaus, and J. Frank, unpublished results). The color of the tRNA portion of the ribosome-bound ternary complex is now shown in pink to identify the ribosomal A site. Similarly, in the subsequent panels, as the tRNA moves through the ribosome, its color coding is changed to identify a particular site. After GTP hydrolysis and release of the EF-Tu in its GDP conformation, tRNA is delivered to the A site. This results in the PRE state (c) of the ribosome with A (pink) and P (green) sites occupied. After spontaneous peptide bond formation, the CCA end of the A-site tRNA moves into the APep-state (violet; d). At this stage, the EF-G–GTP complex (purple) binds to the ribosome (e) to facilitate translocation of tRNA from the APep-state (violet) and P (green) sites to the P (green) and E (yellow) sites, respectively. The translocation reaction is induced by EF-G–dependent GTP hydrolyis accompanied by large transient conformational changes (not shown) in both EF-G and the ribosome (see Agrawal et al. 1999a, Agrawal et al. 2000; Frank and Agrawal 2000). Release of EF-G in its GDP conformation leaves the ribosome in the POST state (f), which is ready to accept another molecule of the ternary complex in the vacated, overlapping binding site. We believe that during the start of the next cycle, i.e., upon binding of a new ternary complex in the A/T state (g), the E-site tRNA (yellow) moves further away from the P-site tRNA (green) to the E2 site (brown). The CCA arm of the E2-site tRNA is shown as dashed line, indicating that its orientation is uncertain (see text).

References

    1. Agrawal R.K., Burma D.P. Sites of ribosomal RNAs involved in the subunit association of tight and loose couple ribosomes. J. Biol. Chem. 1996;271:21285–21291. - PubMed
    1. Agrawal R.K., Frank J. Structural studies of translational apparatus. Curr. Opin. Struct. Biol. 1999;9:215–221. - PubMed
    1. Agrawal R.K., Penczek P., Grassucci R.A., Li Y., Leith A., Nierhaus K.H., Frank J. Direct visualization of A-, P-, and E-site transfer RNAs in the Escherichia coli ribosome. Science. 1996;271:1000–1002. - PubMed
    1. Agrawal R.K., Penczek P., Grassucci R.A., Frank J. Visualization of elongation factor G on the Escherichia coli ribosomethe mechanism of translocation. Proc. Natl. Acad. Sci. USA. 1998;95:6134–6138. - PMC - PubMed
    1. Agrawal R.K., Heagle A.B., Penczek P., Grassucci R.A., Frank J. EF-G-dependent GTP hydrolysis induces translocation accompanied by large conformational changes in the 70S ribosome Nat. Struct. Biol 6 1999. 643 647a - PubMed

Publication types

MeSH terms