. 2000 Aug 7;150(3):627-42.
doi: 10.1083/jcb.150.3.627.

Restructuring of focal adhesion plaques by PI 3-kinase. Regulation by PtdIns (3,4,5)-p(3) binding to alpha-actinin

Affiliations

Restructuring of focal adhesion plaques by PI 3-kinase. Regulation by PtdIns (3,4,5)-p(3) binding to alpha-actinin

J A Greenwood et al. J Cell Biol. .

Abstract

Focal adhesions are an elaborate network of interconnecting proteins linking actin stress fibers to the extracellular matrix substrate. Modulation of the focal adhesion plaque provides a mechanism for the regulation of cellular adhesive strength. Using interference reflection microscopy, we found that activation of phosphoinositide 3-kinase (PI 3-kinase) by PDGF induces the dissipation of focal adhesions. Loss of this close apposition between the cell membrane and the extracellular matrix coincided with a redistribution of alpha-actinin and vinculin from the focal adhesion complex to the Triton X-100-soluble fraction. In contrast, talin and paxillin remained localized to focal adhesions, suggesting that activation of PI 3-kinase induced a restructuring of the plaque rather than complete dispersion. Furthermore, phosphatidylinositol (3,4, 5)-trisphosphate (PtdIns (3,4,5)-P(3)), a lipid product of PI 3-kinase, was sufficient to induce restructuring of the focal adhesion plaque. We also found that PtdIns (3,4,5)-P(3) binds to alpha-actinin in PDGF-treated cells. Further evidence demonstrated that activation of PI 3-kinase by PDGF induced a decrease in the association of alpha-actinin with the integrin beta subunit, and that PtdIns (3,4,5)-P(3) could disrupt this interaction in vitro. Modification of focal adhesion structure by PI 3-kinase and its lipid product, PtdIns (3,4,5)-P(3), has important implications for the regulation of cellular adhesive strength and motility.


Figures

Figure 1
Figure 1
Activation of PI 3-kinase by PDGF in REFs. Cells were grown to 80% confluence, serum-deprived for 18 h in 0.2% FBS-DME, and treated as indicated. Cell lysates were prepared, immunoprecipitated with the indicated antibody, and immunoblotted or assayed for PI 3-kinase activity as described in Materials and Methods. PY20 and RC20 are antiphosphotyrosine antibodies. (A) Time course of PDGF receptor tyrosine phosphorylation in REFs stimulated with 30 ng/ml PDGF. (B) Concentration curve of PDGF receptor tyrosine phosphorylation in cells stimulated with PDGF for 10 min. (C) Time course of the association of the tyrosine-phosphorylated PDGF receptor with PI 3-kinase in cells treated with 30 ng/ml PDGF. (D) Time course of PI 3-kinase activity in antiphosphotyrosine immunoprecipitates from cells stimulated with 30 ng/ml PDGF. (E) PtdIns (3,4,5)-P3 levels from 32Pi-labeled REFs treated with 30 ng/ml PDGF for 10 min in the absence or presence of 100 nM wortmannin (10 min preincubation). Results are representative of one to three separate experiments.
Figure 1
Figure 1
Activation of PI 3-kinase by PDGF in REFs. Cells were grown to 80% confluence, serum-deprived for 18 h in 0.2% FBS-DME, and treated as indicated. Cell lysates were prepared, immunoprecipitated with the indicated antibody, and immunoblotted or assayed for PI 3-kinase activity as described in Materials and Methods. PY20 and RC20 are antiphosphotyrosine antibodies. (A) Time course of PDGF receptor tyrosine phosphorylation in REFs stimulated with 30 ng/ml PDGF. (B) Concentration curve of PDGF receptor tyrosine phosphorylation in cells stimulated with PDGF for 10 min. (C) Time course of the association of the tyrosine-phosphorylated PDGF receptor with PI 3-kinase in cells treated with 30 ng/ml PDGF. (D) Time course of PI 3-kinase activity in antiphosphotyrosine immunoprecipitates from cells stimulated with 30 ng/ml PDGF. (E) PtdIns (3,4,5)-P3 levels from 32Pi-labeled REFs treated with 30 ng/ml PDGF for 10 min in the absence or presence of 100 nM wortmannin (10 min preincubation). Results are representative of one to three separate experiments.
Figure 3
Figure 3
Activation of PI 3-kinase by PDGF induces redistribution of α-actinin. REFs were grown to 80% confluence, serum-deprived for 18 h in 0.2% FBS-DME, rinsed and incubated in DME for 1 h, treated as indicated, and processed for fluorescence microscopy as described in Materials and Methods. Cells were double labeled with anti–α-actinin (A–F) and phalloidin (a–f). (A) Control; (B) PDGF 10 min; (C) PDGF 30 min; (D) wortmannin; (E) PDGF 10 min + wortmannin; (F) PDGF 30 min + wortmannin. Results are representative of 6–13 separate experiments. The soluble (G) and insoluble (H) fractions, which were extracted with Triton X-100 buffer, were separated by electrophoresis and immunoblotted using anti–α-actinin (1:10,000) or stained with Coomassie blue as described in Materials and Methods. Results are representative of one to three separate experiments. The concentration of PDGF was 30 ng/ml. Cells were preincubated with 100 nM wortmannin for 10 min.
Figure 3
Figure 3
Activation of PI 3-kinase by PDGF induces redistribution of α-actinin. REFs were grown to 80% confluence, serum-deprived for 18 h in 0.2% FBS-DME, rinsed and incubated in DME for 1 h, treated as indicated, and processed for fluorescence microscopy as described in Materials and Methods. Cells were double labeled with anti–α-actinin (A–F) and phalloidin (a–f). (A) Control; (B) PDGF 10 min; (C) PDGF 30 min; (D) wortmannin; (E) PDGF 10 min + wortmannin; (F) PDGF 30 min + wortmannin. Results are representative of 6–13 separate experiments. The soluble (G) and insoluble (H) fractions, which were extracted with Triton X-100 buffer, were separated by electrophoresis and immunoblotted using anti–α-actinin (1:10,000) or stained with Coomassie blue as described in Materials and Methods. Results are representative of one to three separate experiments. The concentration of PDGF was 30 ng/ml. Cells were preincubated with 100 nM wortmannin for 10 min.
Figure 2
Figure 2
Activation of PI 3-kinase by PDGF induces focal adhesion disassembly. REFs were grown to 80% confluence, serum-deprived for 18 h in 0.2% FBS-DME, rinsed and incubated in DME for 1 h, treated as indicated, fixed with 3% glutaraldehyde, and examined by IRM as described in Materials and Methods. (A) Control; (B) PDGF 10 min; (C) PDGF 30 min; (D) wortmannin; (E) PDGF 10 min + wortmannin; (F) PDGF 30 min + wortmannin. The concentration of PDGF was 30 ng/ml. Cells were preincubated with 100 nM wortmannin for 10 min. The percent of cells positive for focal adhesions was quantitated for each treatment (G; n = 3–4); error bars represent SEM.
Figure 2
Figure 2
Activation of PI 3-kinase by PDGF induces focal adhesion disassembly. REFs were grown to 80% confluence, serum-deprived for 18 h in 0.2% FBS-DME, rinsed and incubated in DME for 1 h, treated as indicated, fixed with 3% glutaraldehyde, and examined by IRM as described in Materials and Methods. (A) Control; (B) PDGF 10 min; (C) PDGF 30 min; (D) wortmannin; (E) PDGF 10 min + wortmannin; (F) PDGF 30 min + wortmannin. The concentration of PDGF was 30 ng/ml. Cells were preincubated with 100 nM wortmannin for 10 min. The percent of cells positive for focal adhesions was quantitated for each treatment (G; n = 3–4); error bars represent SEM.
Figure 4
Figure 4
Activation of PI 3-kinase by PDGF induces redistribution of vinculin. REFs were grown to 80% confluence, serum-deprived for 18 h in 0.2% FBS-DME, rinsed and incubated in DME for 1 h, treated as indicated, and processed for fluorescence microscopy as described in Materials and Methods. (A) Control; (B) PDGF 10 min; (C) PDGF 30 min; (D) wortmannin; (E) PDGF 10 min + wortmannin; (F) PDGF 30 min + wortmannin. The concentration of PDGF was 30 ng/ml. Cells were preincubated with 100 nM wortmannin for 10 min. Results are representative of three to six separate experiments.
Figure 5
Figure 5
Talin- and paxillin-staining focal adhesion plaques remain in PDGF-treated REFs. Cells were grown to 80% confluence, serum-deprived for 18 h in 0.2% FBS-DME, rinsed and incubated in DME for 1 h, treated as indicated, and processed for fluorescence microscopy as described in Materials and Methods. Cells were stained with antitalin (A–C) or antipaxillin (D–F). (A and D) Control; (B and E) PDGF 10 min; (C and F) PDGF 30 min; (E) PDGF 10 min; (F) PDGF 30 min. The concentration of PDGF was 30 ng/ml. Results are representative of two to three separate experiments.
Figure 6
Figure 6
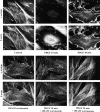
α5β1 integrin–staining focal adhesion plaques remain in PDGF-treated REFs plated on fibronectin. Cells were plated on fibronectin-coated coverslips for 4 h in serum-free DME, treated as indicated, and processed for fluorescence microscopy as described in Materials and Methods. Cells were double labeled with anti–α-actinin (A–C) and phalloidin (a–c) or stained with anti–α5β1 integrin (D–F). (A, a, and D) Control; (B, b, and E) PDGF 10 min; (C, c, and F) PDGF 30 min. The concentration of PDGF was 30 ng/ml. Results are representative of two to three separate experiments.
Figure 7
Figure 7
PtdIns (3,4,5)-P3 induces focal adhesion disassembly. REFs were grown to 80% confluence, serum-deprived for 18 h in 0.2% FBS-DME, rinsed and incubated in DME for 1 h, treated as indicated, fixed with 3% glutaraldehyde, and examined by IRM as described in Materials and Methods. (A) Control; (B) 30 ng/ml PDGF 10 min; (C) 25 μM PtdIns (4,5)-P2; (D) 25 μM PtdIns (3,4,5)-P3. Results are representative of two separate experiments.
Figure 8
Figure 8
PtdIns (3,4,5)-P3 induces redistribution of α-actinin. REFs were grown to 80% confluence, serum-deprived for 18 h in 0.2% FBS-DME, rinsed and incubated in DME for 1 h, treated as indicated, and processed for fluorescence microscopy as described in Materials and Methods. Cells were double labeled with anti–α-actinin (A–D) and phalloidin (a–d). (A) Control; (B) 30 ng/ml PDGF 10 min; (C) 25 μM PtdIns (3,4,5)-P3 30 min; (D) 25 μM PtdIns (4,5)-P2 30 min. Results are representative of five separate experiments.
Figure 11
Figure 11
PtdIns (3,4,5)-P3 binds α-actinin in PDGF-treated cells. (A) 20 μg of purified α-actinin, 500 μg REF cell lysate, or 500 μg BAE cell lysate, was incubated with Affigel-aminopropyl-inositol (1,3,4,5)P4, washed, and the bound protein was eluted and immunoblotted using anti–α-actinin (1:10,000) as described in Materials and Methods. (B–D) REFs were grown to 80% confluence, serum-deprived for 18 h in 0.2% FBS-DME, rinsed and incubated for 1 h in phosphate-free DME containing 0.25 mCi/ml 32Pi followed by stimulation with 30 ng/ml PDGF for the times indicated. Cells were lysed, α-actinin was immunoprecipitated, and the associated phosphoinositides were extracted or the protein was eluted as described in Materials and Methods. (B) Autoradiograph of the TLC plate exposed for 17 h, optimal time for the visualization of PtdIns-P and PtdIns-P2. (C) Autoradiograph of the same TLC plate exposed for 48 h, the optimal time for the visualization of PtdIns (3,4,5)-P3. (D) Immunoblot showing that equal amounts of α-actinin were immunoprecipitated from each sample. Results are representative of four separate experiments.
Figure 11
Figure 11
PtdIns (3,4,5)-P3 binds α-actinin in PDGF-treated cells. (A) 20 μg of purified α-actinin, 500 μg REF cell lysate, or 500 μg BAE cell lysate, was incubated with Affigel-aminopropyl-inositol (1,3,4,5)P4, washed, and the bound protein was eluted and immunoblotted using anti–α-actinin (1:10,000) as described in Materials and Methods. (B–D) REFs were grown to 80% confluence, serum-deprived for 18 h in 0.2% FBS-DME, rinsed and incubated for 1 h in phosphate-free DME containing 0.25 mCi/ml 32Pi followed by stimulation with 30 ng/ml PDGF for the times indicated. Cells were lysed, α-actinin was immunoprecipitated, and the associated phosphoinositides were extracted or the protein was eluted as described in Materials and Methods. (B) Autoradiograph of the TLC plate exposed for 17 h, optimal time for the visualization of PtdIns-P and PtdIns-P2. (C) Autoradiograph of the same TLC plate exposed for 48 h, the optimal time for the visualization of PtdIns (3,4,5)-P3. (D) Immunoblot showing that equal amounts of α-actinin were immunoprecipitated from each sample. Results are representative of four separate experiments.
Figure 9
Figure 9
PtdIns (3,4,5)-P3 induces redistribution of vinculin. REFs were grown to 80% confluence, serum-deprived for 18 h in 0.2% FBS-DME, rinsed and incubated in DME for 1 h, treated as indicated, and processed for fluorescence microscopy as described in Materials and Methods. (A) Control; (B) 30 ng/ml PDGF 10 min; (C) 25 μM PtdIns (4,5)-P2 30 min; (D) 25 μM PtdIns (3,4,5)-P3 30 min. Results are representative of two separate experiments.
Figure 13
Figure 13
PtdIns (3,4,5)-P3 disrupts the binding of α-actinin to the cytoplasmic tail of the β1 integrin. (A) 200 nM of α-actinin and 200 nM GST-β1 cytoplasmic tail were incubated for 1 h, the complex was immunoprecipitated with anti–α-actinin, and the precipitated protein was examined by Coomassie staining or immunoblotting with anti-GST (1:1,000) as described in Materials and Methods. (B) α-Actinin immunoprecipitates were washed twice and incubated with 20 μg of the indicated phospholipid. Immunoprecipitates were washed, and the protein was eluted and examined by Coomassie staining or immunoblotting with anti-GST (1:1,000) as described in Materials and Methods. Anti-GST immunoblots were analyzed by scanning densitometry and quantitated using NIH Image. Error bars represent SEM (n = 4). Asterisk indicates P < 0.001.
Figure 13
Figure 13
PtdIns (3,4,5)-P3 disrupts the binding of α-actinin to the cytoplasmic tail of the β1 integrin. (A) 200 nM of α-actinin and 200 nM GST-β1 cytoplasmic tail were incubated for 1 h, the complex was immunoprecipitated with anti–α-actinin, and the precipitated protein was examined by Coomassie staining or immunoblotting with anti-GST (1:1,000) as described in Materials and Methods. (B) α-Actinin immunoprecipitates were washed twice and incubated with 20 μg of the indicated phospholipid. Immunoprecipitates were washed, and the protein was eluted and examined by Coomassie staining or immunoblotting with anti-GST (1:1,000) as described in Materials and Methods. Anti-GST immunoblots were analyzed by scanning densitometry and quantitated using NIH Image. Error bars represent SEM (n = 4). Asterisk indicates P < 0.001.
Figure 10
Figure 10
di-C12-PI (3,4,5)-P3/AM induces redistribution of α-actinin. REFs were grown to 80% confluence, serum-deprived for 18 h in 0.2% FBS-DME, rinsed and incubated in DME for 1 h, treated as indicated, and processed for fluorescence microscopy as described in Materials and Methods. Cells were double labeled with anti–α-actinin (A and B) and phalloidin (a and b). (A and a) Control; (B and b) 100 μM di-C12-PI (3,4,5)-P3/AM 30 min. Results are representative of two separate experiments.
Figure 12
Figure 12
PtdIns (3,4,5)-P3 disrupts the binding of α-actinin to β3 integrin. (A) REFs were grown to 80% confluence, serum-deprived for 18 h in 0.2% FBS-DME, and rinsed and incubated in DME for 1 h. Cells were treated with 30 ng/ml PDGF for the indicated times in the absence or presence of 100 nM wortmannin (10-min preincubation), lysates were prepared for immunoprecipitation using anti–β3 integrin (IgG), and the precipitated protein was examined by immunoblotting with anti–α-actinin (1:5,000) or anti–β3 integrin (IgM, 1:250) as described in Materials and Methods. (B) β3 integrin immunoprecipitates were washed twice and incubated with 20 μg of the indicated phospholipid. Immunoprecipitates were washed, and the protein was eluted and immunoblotted using anti–α-actinin (1:5,000) or anti–β3 integrin (IgM, 1:250) as described in Materials and Methods. In this experiment, two different forms of PtdIns (3,4,5)-P3, a water-soluble form and a water-insoluble form sonicated to form micelles, were used. Anti–α-actinin immunoblots were analyzed by scanning densitometry and quantitated using NIH Image. Error bars represent SEM (n = 2–3). Asterisk indicates P < 0.05.
Figure 12
Figure 12
PtdIns (3,4,5)-P3 disrupts the binding of α-actinin to β3 integrin. (A) REFs were grown to 80% confluence, serum-deprived for 18 h in 0.2% FBS-DME, and rinsed and incubated in DME for 1 h. Cells were treated with 30 ng/ml PDGF for the indicated times in the absence or presence of 100 nM wortmannin (10-min preincubation), lysates were prepared for immunoprecipitation using anti–β3 integrin (IgG), and the precipitated protein was examined by immunoblotting with anti–α-actinin (1:5,000) or anti–β3 integrin (IgM, 1:250) as described in Materials and Methods. (B) β3 integrin immunoprecipitates were washed twice and incubated with 20 μg of the indicated phospholipid. Immunoprecipitates were washed, and the protein was eluted and immunoblotted using anti–α-actinin (1:5,000) or anti–β3 integrin (IgM, 1:250) as described in Materials and Methods. In this experiment, two different forms of PtdIns (3,4,5)-P3, a water-soluble form and a water-insoluble form sonicated to form micelles, were used. Anti–α-actinin immunoblots were analyzed by scanning densitometry and quantitated using NIH Image. Error bars represent SEM (n = 2–3). Asterisk indicates P < 0.05.

Similar articles

Cited by

References

    1. Blader I.J., Cope M.J., Jackson T.R., Profit A.A., Greenwood A.F., Drubin D.G., Prestwich G.D., Theibert A.B. GCS1, an arf guanosine triphosphate-activating protein in Saccharomyces cerevisiae, is required for normal actin cytoskeletal organization in vivo and stimulates actin polymerization in vitro. Mol. Biol. Cell. 1999;10:581–596. - PMC - PubMed
    1. Blanchard A., Ohanian V., Critchley D. The structure and function of α-actinin. J. Muscle Res. Cell Motil. 1989;10:280–289. - PubMed
    1. Bondeva T., Pirola L., Bulgarelli-Leva G., Rubio I., Wetzker R., Wymann M.P. Bifurcation of lipid and protein kinase signals of PI3Kγ to the protein kinases PKB and MAPK. Science. 1998;282:293–296. - PubMed
    1. Burn P., Rotman A., Meyer R.K., Burger M.M. Diacylglycerol in large α-actinin/actin complexes and in the cytoskeleton of activated platelets. Nature. 1985;314:469–474. - PubMed
    1. Burridge K., Chrzanowska-Wodnicka M. Focal adhesions, contractility, and signaling. Annu. Rev. Cell Dev. Biol. 1996;12:463–519. - PubMed

Publication types

MeSH terms