

Directed evolution of green fluorescent protein by a new versatile PCR strategy for site-directed and semi-random mutagenesis
- PMID: 10931937
- PMCID: PMC108465
- DOI: 10.1093/nar/28.16.e78
Directed evolution of green fluorescent protein by a new versatile PCR strategy for site-directed and semi-random mutagenesis
Abstract
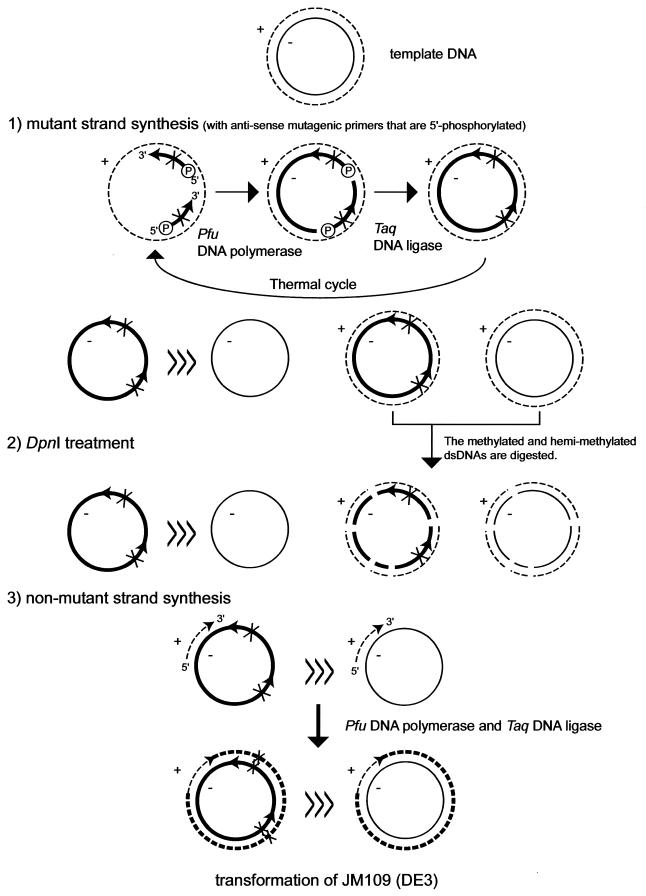
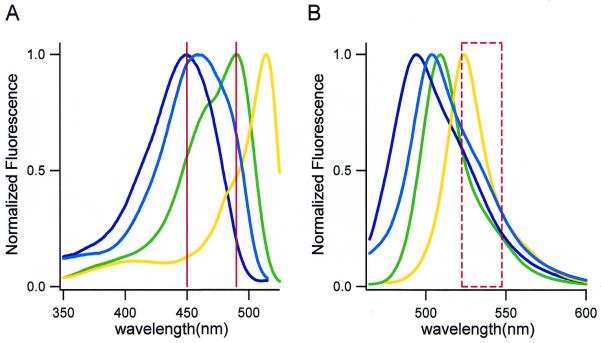
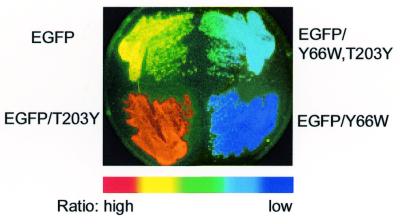
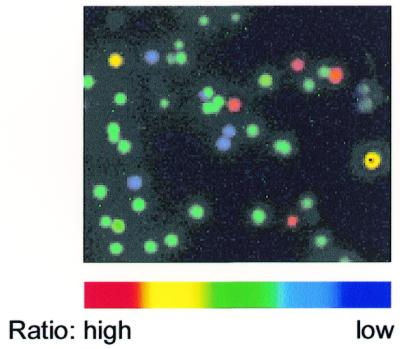
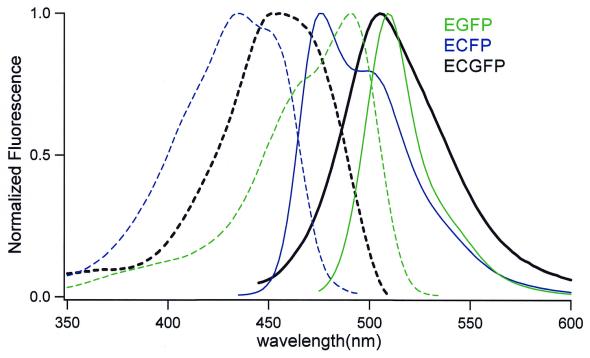
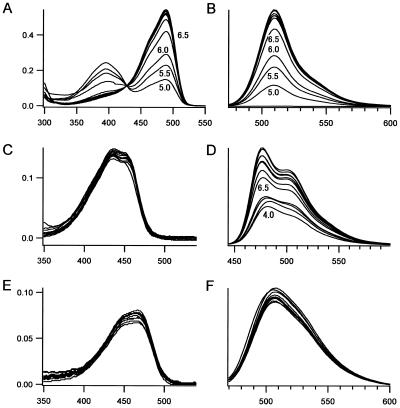
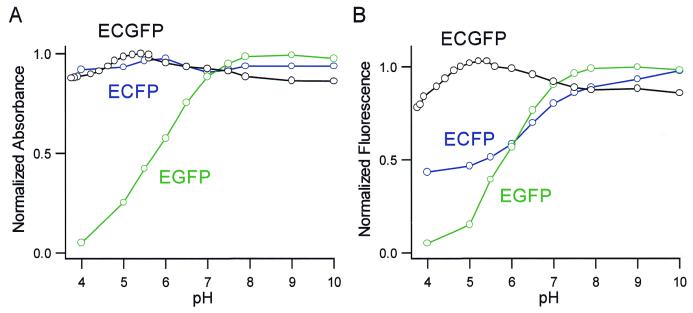
To develop a simple, speedy, economical and widely applicable method for multiple-site mutagenesis, we have substantially modified the Quik-Change Site-Directed Mutagenesis Kit protocol (Stratagene, La Jolla, CA). Our new protocol consists of (i) a PCR reaction using an in vitro technique, LDA (ligation-during-amplification), (ii) a DPN:I treatment to digest parental DNA and to make megaprimers and (iii) a synthesis of double-stranded plasmid DNA for bacterial transformation. While the Quik Change Kit protocol introduces mutations at a single site, requiring two complementary mutagenic oligonucleotides, our new protocol requires only one mutagenic oligonucleotide for a mutation site, and can introduce mutations in a plasmid at multiple sites simultaneously. A targeting efficiency >70% was consistently achieved for multiple-site mutagenesis. Furthermore, the new protocol allows random mutagenesis with degenerative primers, because it does not use two complementary primers. Our mutagenesis strategy was successfully used to alter the fluorescence properties of green fluorescent protein (GFP), creating a new-color GFP mutant, cyan-green fluorescent protein (CGFP). An eminent feature of CGFP is its remarkable stability in a wide pH range (pH 4-12). The use of CGFP would allow us to monitor protein localization quantitatively in acidic organelles in secretory pathways.
Figures
References
-
- Ishii T.M., Zerr,P., Xia,X., Bond,C.T., Maylie,J. and Adelman,J.P. (1998) Methods Enzymol., 293, 53–71. - PubMed
-
- Kunkel T.A., Bebenek,K. and McClary,J. (1991) Methods Enzymol., 204, 125–139. - PubMed
-
- Saiki R.K., Scharf,S., Faloona,F., Mullis,K.B., Horn,G.T., Erlich,H.A. and Arnheim,N. (1985) Science, 230, 1350–1354. - PubMed
-
- Kim Y.-G. and Maas,S. (2000) Biotechniques, 28, 196–198. - PubMed
Publication types
MeSH terms
Substances
Associated data
- Actions
LinkOut - more resources
Full Text Sources
Other Literature Sources
