. 2000 Aug 15;97(17):9783-8.
doi: 10.1073/pnas.160276997.

Altered expression of expansin modulates leaf growth and pedicel abscission in Arabidopsis thaliana

Affiliations

Altered expression of expansin modulates leaf growth and pedicel abscission in Arabidopsis thaliana

H T Cho et al. Proc Natl Acad Sci U S A. .

Abstract

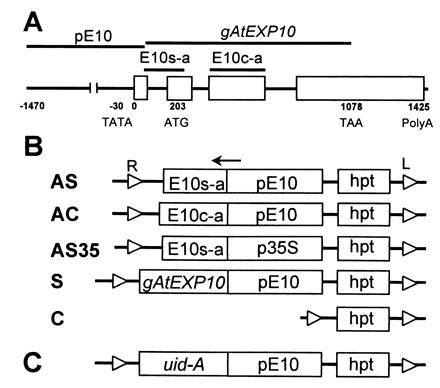
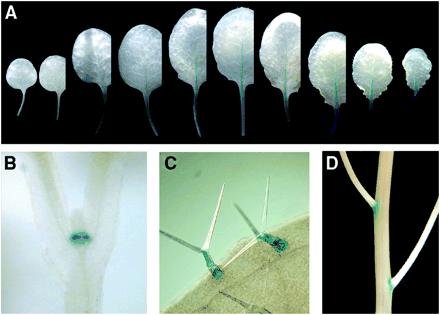
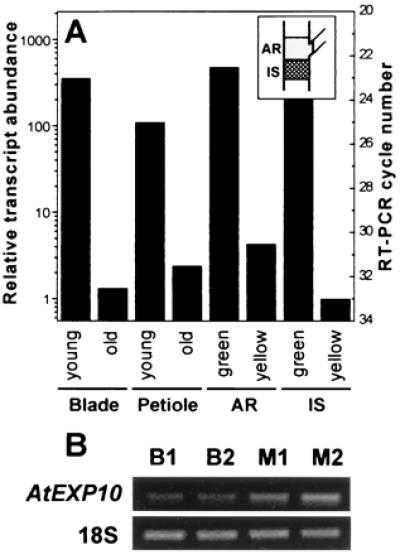
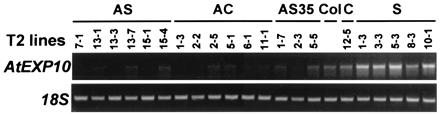
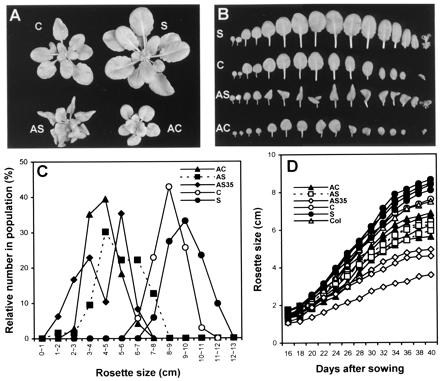
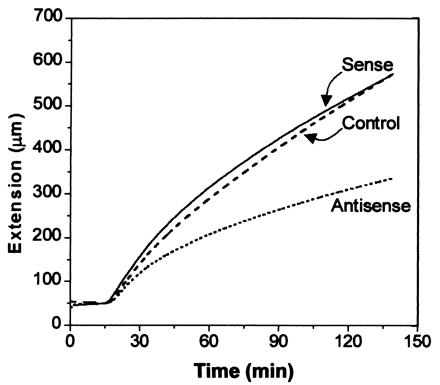
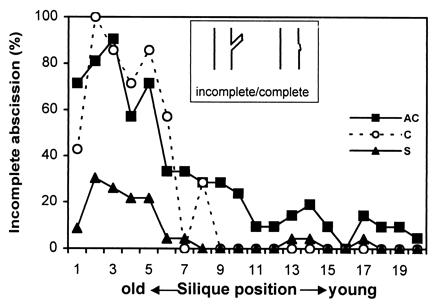
Expansins are cell-wall-loosening proteins that induce stress relaxation and extension of plant cell walls. To evaluate their hypothesized role in cell growth, we genetically manipulated expansin gene expression in Arabidopsis thaliana and assessed the consequent changes in growth and cell-wall properties. Various combinations of promoters were used to drive antisense and sense sequences of AtEXP10, which is maximally expressed in the growing leaf and at the base of the pedicel. Compared with controls, antisense lines had smaller rosettes because of shorter petioles and leaf blades and often acquired a twisted leaf morphology. Petiole cells from antisense plants were smaller than controls and their cell walls were significantly less extensible in vitro. Sense plants had slightly longer petioles, larger leaf blades, and larger cells than controls. Abscission at the base of the pedicel, where AtEXP10 is endogenously expressed, was enhanced in sense plants but reduced in antisense lines. These results support the concept that expansins function endogenously as cell-wall-loosening agents and indicate that expansins have versatile developmental roles that include control of organ size, morphology, and abscission.


Figures

Figure 1
Figure 1
Structure of AtEXP10 and antisense, sense, and control constructs for Arabidopsis transformation. (A) Gene structure of AtEXP10. Open boxes represent exons. E10s-a and E10c-a indicate the regions from which antisense sequences were prepared for AS (or AS35) and AC, respectively. A sense sequence was prepared from gAtEXP10. pE10 represents the promoter region of AtEXP10. (B) Transgene constructs. AS, antisense construct specific to AtEXP10 (E10s-a) driven by pE10; AC, antisense construct containing AtEXP10 coding region (E10c-a) and driven by pE10; AS35, antisense construct specific to AtEXP10 (E10s-a) driven by 35S CaMV promoter (p35S); S, sense construct containing genomic AtEXP10 (gAtEXP10) and driven by pE10; C, control construct containing only hygromycin phosphotransferase gene cassette (hpt) as a selectable marker. Small open triangles at the end of the each line represent right border (R) and left border (L) of the T-DNA in Agrobacterium Ti (tumor-inducing) plasmid. The arrow indicates the direction of transcription. (C) The construct for expression of GUS driven by pE10 (AtEXP10∷GUS).
Figure 2
Figure 2
Expression of AtEXP10∷GUS in Arabidopsis. AtEXP10 is expressed in the petiole and midrib [in leaves from a 29-day-old-plant (A)], the base of the emerging first leaves [in a 5-day-old plant (B)], the trichomes (C), and the pedicel abscission region (D). In A, leaves are arranged from the first leaf at the left.
Figure 3
Figure 3
RT-PCR analysis of AtEXP10 expression in selected Arabidopsis tissues. (A) Quantitative RT-PCR analysis of the RNA from young and old leaf blades and petioles, from pedicel abscission regions (AR, see Inset), and from the inflorescence stems (IS) subtending AR. The young blade and petiole are from the fifth leaf of 21-day-old plants and the old ones are from the fifth leaf of 35-day-old plants. AR and IS tissues were taken when the siliques were green (young) or yellow (old). Relative transcript abundance was calculated from the minimum number of cycles needed for detection of the amplified product on an ethidium bromide-stained gel. Amplification by 1.8-fold per cycle was assumed. The minimum number of cycles is shown on the right axis and is an average of two to four repeats. (B) RT-PCR results of RNA from the midrib (M) and the blade (B) tissues. Total RNA of each tissue was prepared from the eighth leaf of 27-day-old plants. The numbers indicate different RNA preparations. Primers for 18S rRNA (18S) were used for an internal loading standard in A and B. In B, the RT-PCR cycle numbers were 29 for AtEXP10 and 16 for 18S.
Figure 4
Figure 4
RT-PCR analysis of AtEXP10 expression in selected transgenic lines. RNA from the fifth leaf of 21-day-old T2 plants was analyzed. The RT-PCR cycle numbers were 28 for AtEXP10 and 16 for 18S. Col, Columbia wild type.
Figure 5
Figure 5
Effect of AtEXP10 transgenes on rosette and leaf growth. (A) Rosettes from 35-day-old T2 plants. The sense plant (S) shown here is the progeny of the T1 line with the largest rosette size (11–12 cm), as shown in Fig. 5C; the AS plant is from the T1 line with most severely malformed leaves; and the AC plant is from the T1 line with smallest rosette size (2–3 cm) but with mildly deformed leaves. (B) Alignment of rosette leaves of transgenic plants shown in A, arranged left to right from first to last leaves to emerge. (C) Distribution of rosette size in the T1 generation of transgenic plants. The number of plants observed is 71 (AC), 64 (AS), 48 (AS35), 35 (C), and 51 (S). The maximum rosette size was measured at 50–60 days after sowing. (D) Growth kinetics of T2 plants. Each curve represents an independent transgenic line, and each data point is the average of measurements from 7 to 10 plants. The maximum rosette sizes of the T1 lines selected for this T2 analysis (also for Table 1) were 4–6 cm for AS lines, 3–6 cm for AC lines, 2–5 cm for AS35 lines, 9–11 cm for S lines, and 8–9 cm for the C line. Col, Columbia wild type.
Figure 6
Figure 6
Extension of cell walls from growing petioles of transgenic plants. Native wall specimens from the seventh leaf of 29-day-old T3 plants were clamped at constant load, initially in 50 mM Hepes buffer, pH 6.8, and at 15 min the buffer was exchanged for 50 mM sodium acetate, pH 4.5, to activate expansin-induced extension. These curves are the averages of four, eight, or nine samples for control (C12–5 line), antisense (AS13–1), and sense (S9–1) plants. The antisense curve was significantly different from the control and sense curves (Student's t test, P < 0.05).
Figure 7
Figure 7
Pattern of pedicel abscission in transgenic plants. Abscission was evaluated as percentage of incomplete abscission where breakage occurs in the middle of pedicel instead of at the exact abscission region. Data are from 21 plants (from four independent lines) for AC, 9 plants (from one line) for C, and 23 plants (from four independent lines) for S. (Inset) Depiction of the breakage pattern seen with incomplete or complete abscission.

References

    1. Cosgrove D J. Annu Rev Plant Physiol Plant Mol Biol. 1999;50:391–417. - PubMed
    1. Carpita N C, Gibeaut D M. Plant J. 1993;3:1–30. - PubMed
    1. Gonzalez-Carranza Z H, Roberts J A, Lozoya-Gloria E. Trends Plant Sci. 1998;3:10–14.
    1. Rose J K C, Bennett A B. Trends Plant Sci. 1999;4:176–183. - PubMed
    1. Brummell D A, Hall B D, Bennett A B. Plant Mol Biol. 1999;40:615–622. - PubMed

Publication types

MeSH terms

Associated data

LinkOut - more resources