

Fluorescence spectroscopy of neoplastic and non-neoplastic tissues
- PMID: 10933071
- PMCID: PMC1531869
- DOI: 10.1038/sj.neo.7900077
Fluorescence spectroscopy of neoplastic and non-neoplastic tissues
Abstract
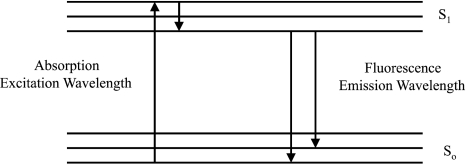
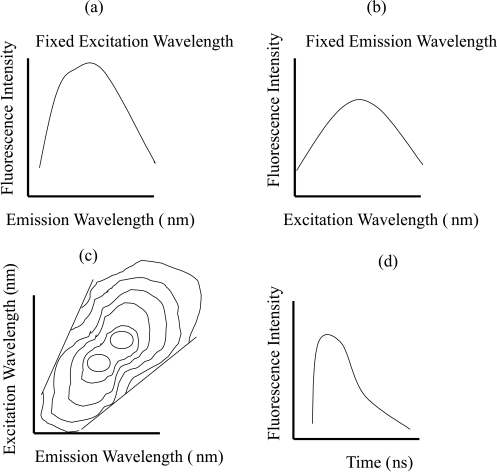
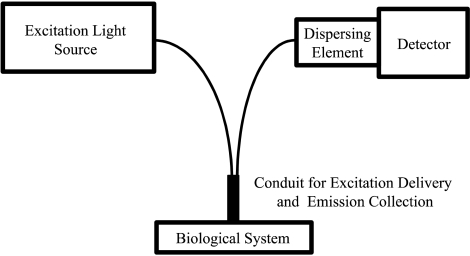
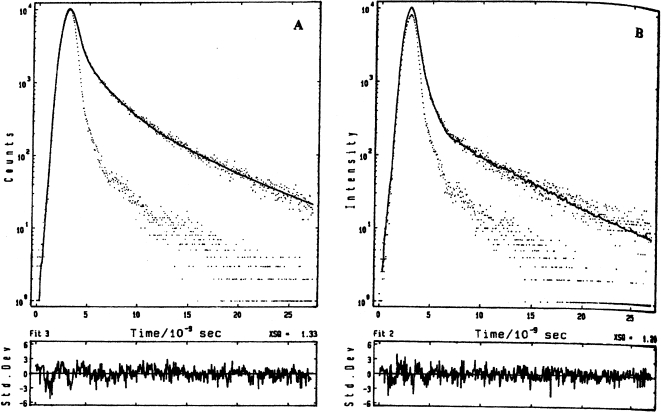
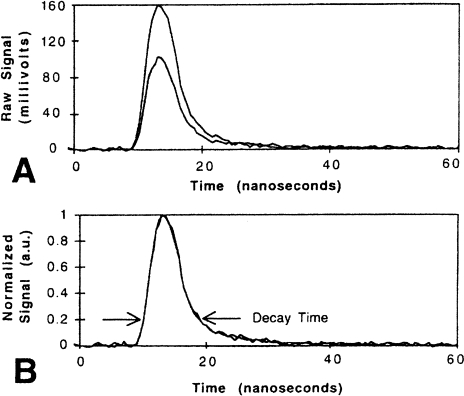
Fast and non-invasive, diagnostic techniques based on fluorescence spectroscopy have the potential to link the biochemical and morphologic properties of tissues to individual patient care. One of the most widely explored applications of fluorescence spectroscopy is the detection of endoscopically invisible, early neoplastic growth in epithelial tissue sites. Currently, there are no effective diagnostic techniques for these early tissue transformations. If fluorescence spectroscopy can be applied successfully as a diagnostic technique in this clinical context, it may increase the potential for curative treatment, and thus, reduce complications and health care costs. Steady-state, fluorescence measurements from small tissue regions as well as relatively large tissue fields have been performed. To a much lesser extent, time-resolved, fluorescence measurements have also been explored for tissue characterization. Furthermore, sources of both intrinsic (endogenous fluorophores) and extrinsic fluorescence (exogenous fluorophores) have been considered. The goal of the current report is to provide a comprehensive review on steady-state and time-resolved, fluorescence measurements of neoplastic and non-neoplastic, biologic systems of varying degrees of complexity. First, the principles and methodology of fluorescence spectroscopy are discussed. Next, the endogenous fluorescence properties of cells, frozen tissue sections and excised and intact bulk tissues are presented; fluorescence measurements from both animal and human tissue models are discussed. This is concluded with future perspectives.
Figures

References
-
- Wagnieres GA, Star WM, Wilson BC. In vivo fluorescence spectroscopy and imaging for oncological applications. Photochem Photobiol. 1998;68(5):603–632. - PubMed
-
- Richards-Kortum R, Sevick-Muraca E. Quantitative optical spectroscopy for tissue diagnosis. Annu Rev Phys Chem. 1996;47:555–606. - PubMed
-
- Andersson-Engels S, Johansson J, Stenram U, Svanberg K, Svanberg S. Malignant tumor and atherosclerotic plaque diagnosis using laser induced fluorescence. IEEE J Quantum Electron. 1990;26(12):2207–2217.
-
- Andersson-Engels A, Johansson J, Svanberg K, Svanberg S. Fluorescence imaging and point measurements of tissue: applications to the demarcation of malignant tumors and atherosclerotic lesions from normal tissue. Photochem Photobiol. 1991;53(6):807–814. - PubMed
-
- Andersson-Engels S, Wilson BC. In vivo fluorescence in clinical oncology: fundamentals and practical issues. J Cell Pharmacol. 1992;3:66–79.
Publication types
MeSH terms
LinkOut - more resources
Full Text Sources
Other Literature Sources