Review
. 2000 Jan-Apr;2(1-2):139-51.
doi: 10.1038/sj.neo.7900076.

Applications of magnetic resonance in model systems: tumor biology and physiology

Affiliations
Review

Applications of magnetic resonance in model systems: tumor biology and physiology

R J Gillies et al. Neoplasia. 2000 Jan-Apr.

Abstract

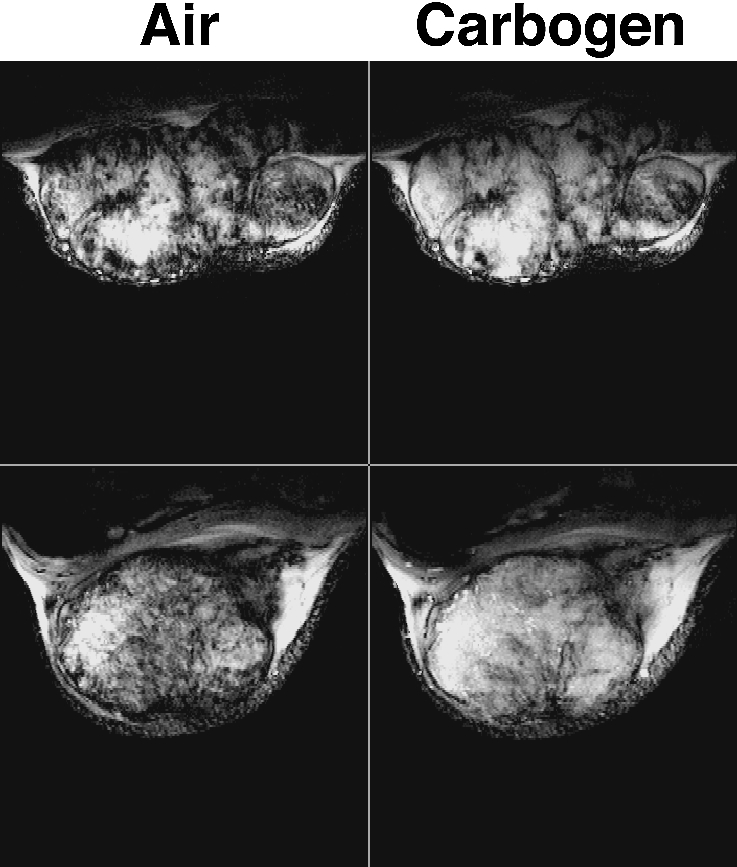
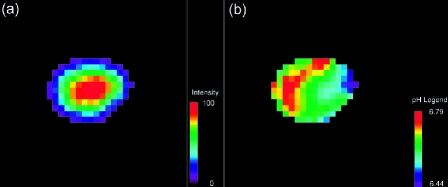
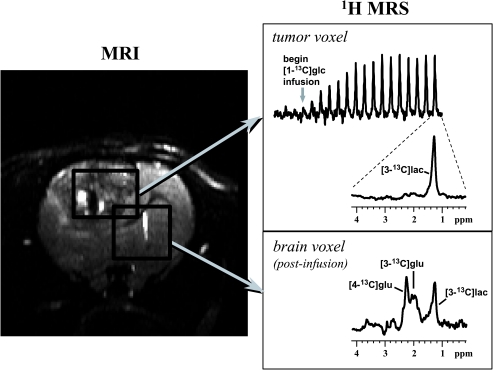
A solid tumor presents a unique challenge as a system in which the dynamics of the relationship between vascularization, the physiological environment and metabolism are continually changing with growth and following treatment. Magnetic resonance imaging (MRI) and magnetic resonance spectroscopy (MRS) studies have demonstrated quantifiable linkages between the physiological environment, angiogenesis, vascularization and metabolism of tumors. The dynamics between these parameters continually change with tumor aggressiveness, tumor growth and during therapy and each of these can be monitored longitudinally, quantitatively and non-invasively with MRI and MRS. An important aspect of MRI and MRS studies is that techniques and findings are easily translated between systems. Hence, pre-clinical studies using cultured cells or experimental animals have a high connectivity to potential clinical utility. In the following review, leaders in the field of MR studies of basic tumor physiology using pre-clinical models have contributed individual sections according to their expertise and outlook. The following review is a cogent and timely overview of the current capabilities and state-of-the-art of MRI and MRS as applied to experimental cancers. A companion review deals with the application of MR methods to anticancer therapy.


Figures

Figure 1
Figure 1
(A) The correlation between GdDTPA-uptake rates (k) and the perfused vascular surface-areas (S) in voxels of 10 9L-gliomas. The solid line indicates the results of the least-squares linear regression analysis of the data: k = 0.23 ± 0.02 SDxS, R2 = 0.72 (n = 86). (B) Surface-plot of correlations between the PS-product (x-axis), TBP (y-axis) and GdDTPA-uptake rate constants (k) (z-axis) using the definition of the rate constant k as proposed by Kety [27] or Larsson et al. [28]. Note that the range of k-values is comparable to the range in (Figure 2A). These data are from work performed by B vander Sanden with grateful acknowledgements to Dr. T.H. Rozijn, Dr. W.M.M.J. Bovee, P.F.J.W. Rijken, Prof. A.J. van der Kogel and Prof. A. Heerschap.
Figure 2
Figure 2
Three-dimensional reconstructed maps obtained from a single MDA-MB-435-1β tumor. (a) Sections stained for VEGF expression using a rabbit polyclonal anti-VEGF antibody (Santa Cruz Biotechnology Santa Cruz, CA). (b) Hematoxylin/eosin-stained histologic sections. (c) MRI map of vascular permeability. (d) MRI map of vascular volume. (e,f) Three-dimensional and triplanar views of a fused vascular image obtained by displaying vascular volume through a green channel and vascular permeability through a red channel. Multi-slice maps of relaxation rates (T1-1) were obtained by a saturation recovery method combined with fast T1 SNAPSHOT-FLASH imaging (flip angle of 5° echo time of 2 msec). Images of eight slices (slice thickness of 1 mm) acquired with an in-plane spatial resolution of 250 µm (64x64 matrix, 16 mm field of view, NS = 16) were obtained for three relaxation delays (100 msec, 500 msec, and 1 second) for each of the slices. Thus, 64x64x8 T1 maps were acquired within 7 minutes with an Mo map with a recovery delay of 7 seconds acquired once at the beginning of the experiment. Images were obtained before i.v. administration of 0.2 ml of 60 mg/ml albumin-GdDTPA in saline (dose of 500 mg/kg) and repeated every 8 minutes, starting 10 minutes after the injection, up to 32 minutes. Relaxation maps are reconstructed from data sets for three different relaxation times and the Mo data set on a pixel-by-pixel basis. These data are from work performed by D. Artemov, M. Solaiyappan and Z. M. Bhujwalla.
Figure 3
Figure 3
Vascular collapse in response to VEGF withdrawal. Signal enhancement in response to hyperoxia was monitored in C6-pTET-VEGF tumors in nude mice, by switching the mice from inhalation of 95% air/5% CO2 tp 95% O2/5% CO2 (carbogen). (A) In the absence of tetracycline, the tumors were hypervascular in accord with over-expression of VEGF. (B) Forty-eight hours after administration of tetracycline, suppressing VEGF over-expression, a significant drop in vascular function was observed (see also Refs. [20,21]). These data are from work performed by R. Abramovitch, H. Dafni, E. Smouha, L. Benjamin and M. Neeman.
Figure 4
Figure 4
Oxygen-tension mapping in a radiation-induced fibrosarcoma (RIF-1) tumor implanted on the lower back of a C3H mouse which received a 10 g/kg dose of perfluoro-15-crown-5-ether 4 days before imaging at 2.0 T. Upper Left: Coronal 1H spin-echo image of RIF-1 tumor, 256x256 pixel resolution, repetition time (TR) = 1 second, echo time (TE) = 25 msec, field of view (FOV) = 30 mm, slice thickness of 2 mm, 128 phase-encoding steps, number of averages (NEX) = 2. Upper Center: Coronal projection 19F spin-echo image of sequestered perfluoro-15-crown-5-ether in same tumor as in Upper Left, 128x128 pixel resolution, TR = 5 seconds, TE = 25 msec, FOV = 30 mm, 64 phase-encoding steps, NEX = 4, total image acquisition time = 21 minutes. Upper Right: Coronal projection 19F-inversion recovery-EPI of same tumor as in Upper Left, 64x64 pixel resolution, TR = 10 seconds, TE = 30 msec, inversion time (TI) = 80 msec, FOV = 30 mm, NEX = 8, total image acquisition time = 80 seconds. Lower Left: Calculated pO2 map (from seven IR-EPIs, like that shown in Upper Right, with TI values of 0.08, 0.20, 0.50, 1.0, 2.0, 4.0, and 8.0 seconds, respectively) for animal breathing air. Color indicates pO2 values from 0 to >25 Torr. Lower Center: Calculated pO2 map as in Lower Left, but with animal breathing carbogen (95% O2/5% CO2) for 15 minutes. Lower Right: Difference in pO2 map obtained by subtracting pO2 map in Lower Left from pO2 map in Lower Center (carbogen-air). Color scale now indicates change in pO2 from -12.5 to +12.5 Torr. Oxygen tension maps have been cropped to remove some of the background noise region shown in Upper Right. These data are from work performed by C. Sotak, with grateful acknowledgement to K. Helmer and M. Meiler.
Figure 5
Figure 5
GRE images obtained from two rat transplanted GH3 prolactinomas grown subcutaneously in the flank, acquired whilst the host breathed air and subsequently carbogen (95% O2/5% CO2). Images are typically heterogeneous, with regions of intense signal (long T2* hence low [deoxyhaemoglobin]) becoming more so during carbogen breathing. Within some of these regions, intensity increases can be observed for structures that are attributed to large tumor blood vessels. Other regions giving rise to little or no signal (short T2* hence higher [deoxyhaemoglobin]) are unaffected by carbogen breathing and probably correspond to areas of either low blood flow/hypoxia or necrosis, though this has still to be addressed. These data are from work performed by S. Robinson, with grateful acknowledgement to Prof. J.R. Griffiths.
Figure 6
Figure 6
(a) Intensity map of the H2 resonance of IEPA in a coronal slice through an MDAmb-435 human breast cancer tumor growing in an SCID mouse. (b) Corresponding extracellular pH map, calculated from the chemical shift of the IEPA resonance (Ref. [93]) (reprinted with permission from Wiley-Liss). These data are from work performed by R. van Sluis, with grateful acknowledgement to Prof. R.J. Gillies and Dr. N. Raghunand.
Figure 7
Figure 7
The left panel shows a T2-weighted image of a C6 glioma (coronal view). Rectangles outline two dimensions of the tissue volumes selected from tumor and the contralateral hemisphere for the spectroscopic measurements. 1H spectra from tumor (b) and contralateral hemisphere (c) were acquired while infusing [1-13C]glucose intravenously. These spectra were acquired with a special 1H-MRS technique that detects signals from 13C-labeled compounds only. These data are from work performed by M. Garwood.

References

    1. Goldmann E. The growth of malignant disease in man and the lower animals, with special reference to the vascular system. Proc R Soc Med. 1907;1:1–13. - PMC - PubMed
    1. Algire GH, Chalkley HW, Legallais FY, Park HD. Vascular Reactions of normal and malignant tissues in vivo: I. Vascular reactions of mice to wounds and to normal and neoplastic transplants. J Natl Cancer Inst. 1945;6:73–85.
    1. Alper T, Howard-Flanders P. Role of oxygen in modifying the radiosensitivity of E. coli B. Nature. 1956;178:978–979. - PubMed
    1. Thomlinson RH, Gray LH. The histological structure of some human lung cancers and the possible implications for radiotherapy. Br J Cancer. 1955;9:539–549. - PMC - PubMed
    1. Jain JK. Determinants of tumor blood flow: a review. Cancer Res. 1988;48:2641–2658. - PubMed

Publication types

LinkOut - more resources