

alpha-synuclein promotes mitochondrial deficit and oxidative stress
- PMID: 10934145
- PMCID: PMC1850140
- DOI: 10.1016/s0002-9440(10)64553-1
alpha-synuclein promotes mitochondrial deficit and oxidative stress
Abstract
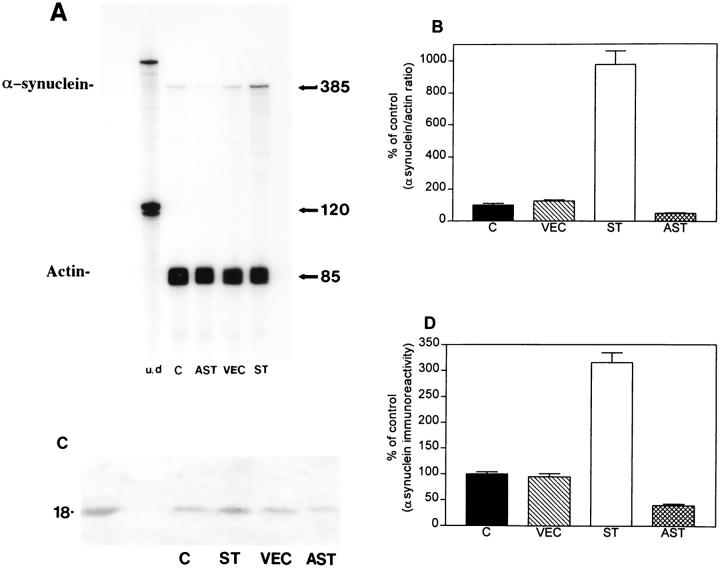
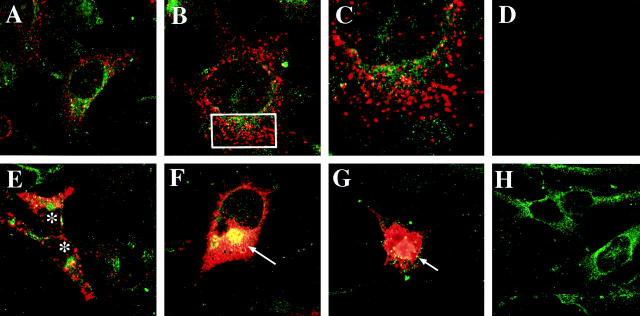
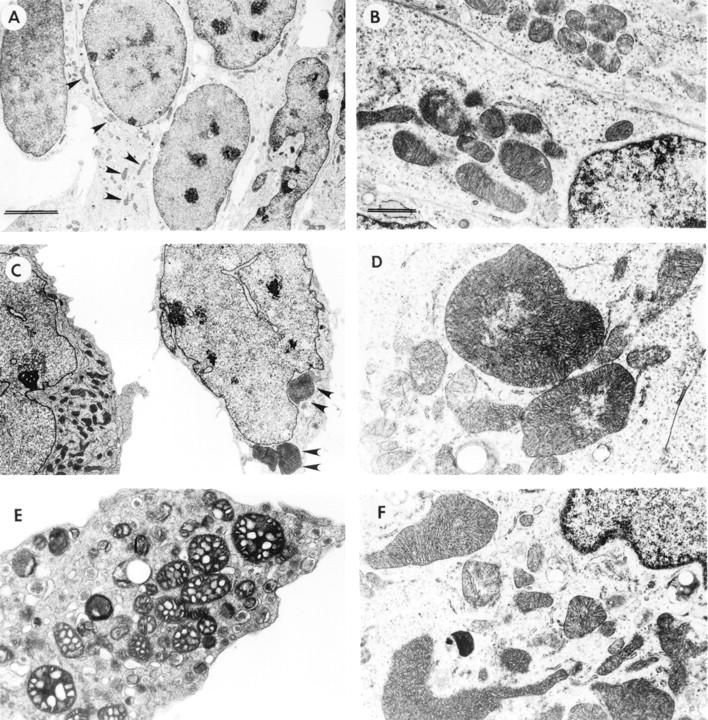
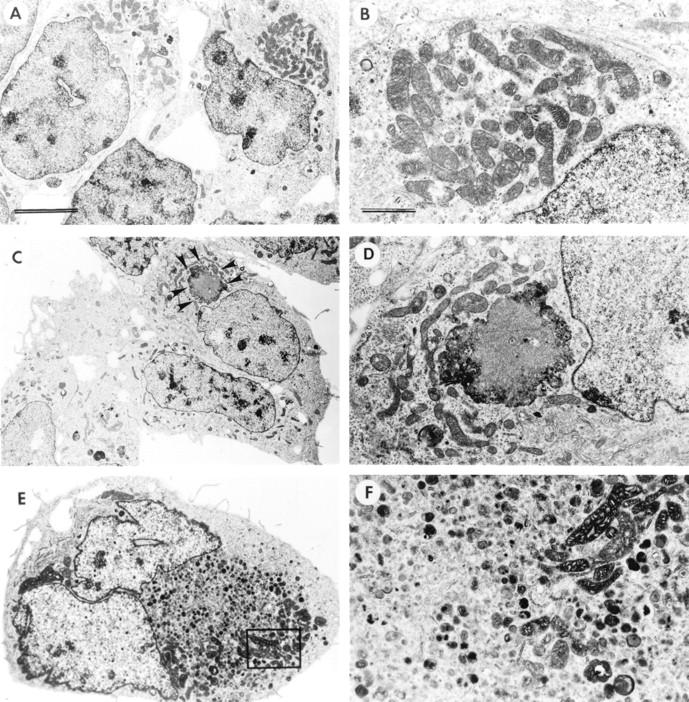
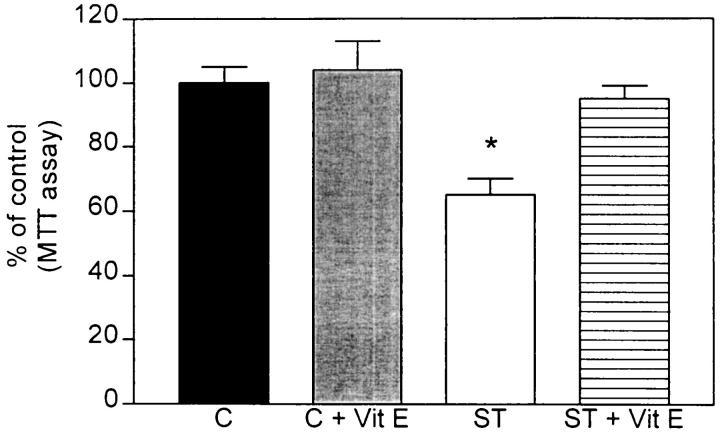
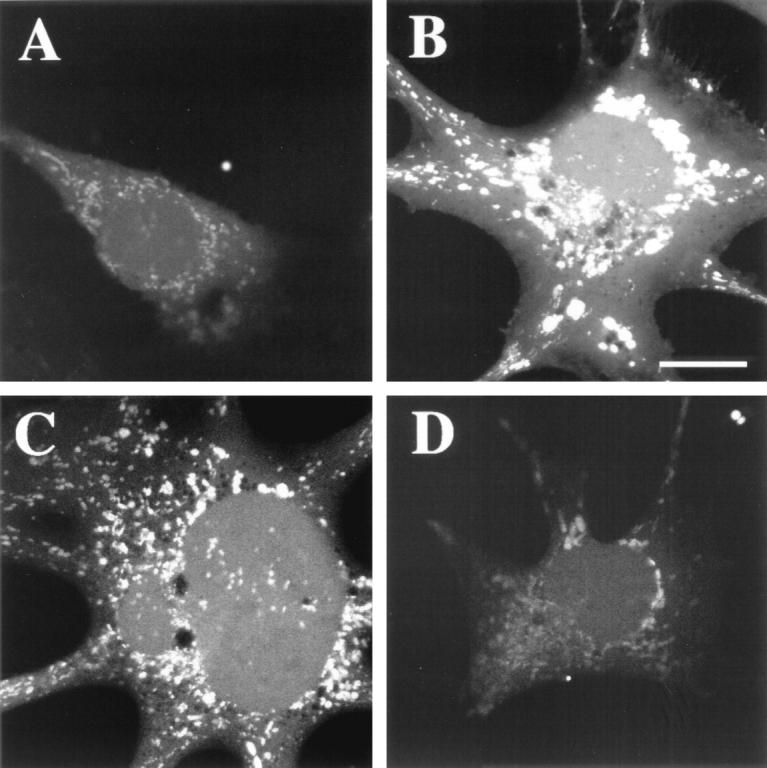
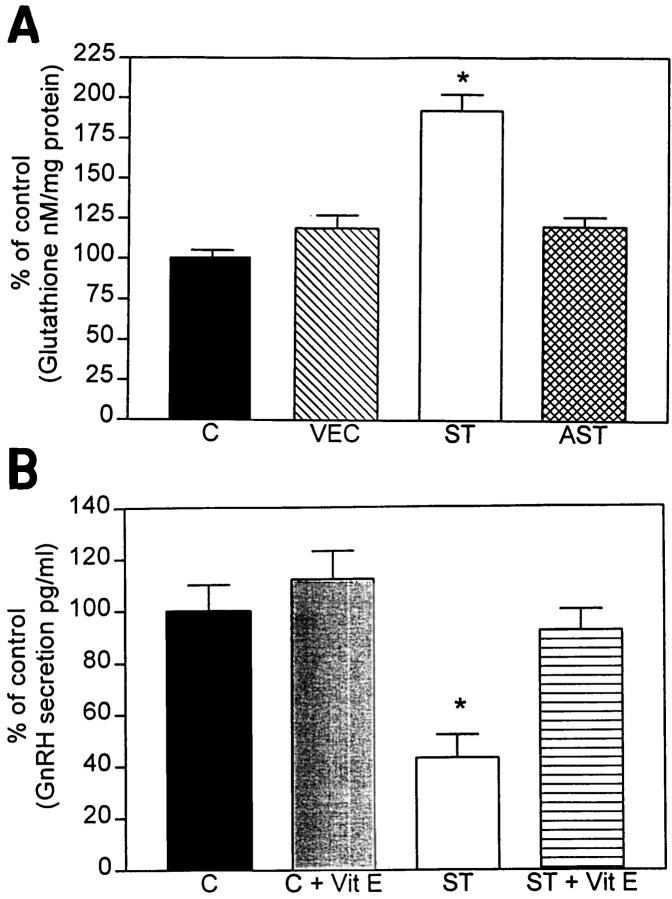
Abnormal accumulation of the presynaptic protein alpha-synuclein has recently been implicated in the pathogenesis of Alzheimer's and Parkinson's diseases. Because neurodegeneration in these conditions might be associated with mitochondrial dysfunction and oxidative stress, the effects of alpha-synuclein were investigated in a hypothalamic neuronal cell line (GT1-7). alpha-Synuclein overexpression in these cells resulted in formation of alpha-synuclein-immunopositive inclusion-like structures and mitochondrial alterations accompanied by increased levels of free radicals and decreased secretion of gonadotropin-releasing hormone. These alterations were ameliorated by pretreatment with anti-oxidants such as vitamin E. Taken together these results suggest that abnormal accumulation of alpha-synuclein could lead to mitochondrial alterations that may result in oxidative stress and, eventually, cell death.
Figures
Similar articles
-
Role of protein aggregation in mitochondrial dysfunction and neurodegeneration in Alzheimer's and Parkinson's diseases.Neuromolecular Med. 2003;4(1-2):21-36. doi: 10.1385/NMM:4:1-2:21. Neuromolecular Med. 2003. PMID: 14528050 Review.
-
Effect of the overexpression of wild-type or mutant alpha-synuclein on cell susceptibility to insult.J Neurochem. 2001 Feb;76(4):998-1009. doi: 10.1046/j.1471-4159.2001.00149.x. J Neurochem. 2001. PMID: 11181819
-
alpha-synuclein aggregation: a link between mitochondrial defects and Parkinson's disease?Antioxid Redox Signal. 2003 Jun;5(3):337-48. doi: 10.1089/152308603322110904. Antioxid Redox Signal. 2003. PMID: 12880487 Review.
-
Role of oxidative damage in protein aggregation associated with Parkinson's disease and related disorders.Antioxid Redox Signal. 2005 May-Jun;7(5-6):672-84. doi: 10.1089/ars.2005.7.672. Antioxid Redox Signal. 2005. PMID: 15890012 Review.
-
Alpha-synuclein overexpression and aggregation exacerbates impairment of mitochondrial functions by augmenting oxidative stress in human neuroblastoma cells.Int J Biochem Cell Biol. 2009 Oct;41(10):2015-24. doi: 10.1016/j.biocel.2009.05.008. Epub 2009 May 19. Int J Biochem Cell Biol. 2009. PMID: 19460457
Cited by
-
Mitochondrial dysfunction in Parkinson's disease - a key disease hallmark with therapeutic potential.Mol Neurodegener. 2023 Nov 11;18(1):83. doi: 10.1186/s13024-023-00676-7. Mol Neurodegener. 2023. PMID: 37951933 Free PMC article. Review.
-
α-Synuclein binds to TOM20 and inhibits mitochondrial protein import in Parkinson's disease.Sci Transl Med. 2016 Jun 8;8(342):342ra78. doi: 10.1126/scitranslmed.aaf3634. Sci Transl Med. 2016. PMID: 27280685 Free PMC article.
-
Urate is closely linked to white matter integrity in multiple system atrophy.Ann Clin Transl Neurol. 2020 Jun;7(6):1029-1039. doi: 10.1002/acn3.51073. Ann Clin Transl Neurol. 2020. PMID: 32588990 Free PMC article.
-
Derivation, Characterization, and Neural Differentiation of Integration-Free Induced Pluripotent Stem Cell Lines from Parkinson's Disease Patients Carrying SNCA, LRRK2, PARK2, and GBA Mutations.PLoS One. 2016 May 18;11(5):e0154890. doi: 10.1371/journal.pone.0154890. eCollection 2016. PLoS One. 2016. PMID: 27191603 Free PMC article.
-
The mitochondrial chaperone protein TRAP1 mitigates α-Synuclein toxicity.PLoS Genet. 2012 Feb;8(2):e1002488. doi: 10.1371/journal.pgen.1002488. Epub 2012 Feb 2. PLoS Genet. 2012. PMID: 22319455 Free PMC article.
References
-
- Jakes R, Spillantini MG, Goedert M: Identification of two distinct synucleins from human brain. FEBS Lett 1994, 345:27-32 - PubMed
-
- Maroteaux L, Scheller RH: The rat brain synucleins; family of proteins transiently associated with neuronal membrane. Brain Res Mol Brain Res 1991, 11:335-343 - PubMed
-
- George JM, Jin H, Woods WS, Clayton DF: Characterization of a novel protein regulated during the critical period for song learning in the zebra finch. Neuron 1995, 15:361-372 - PubMed
Publication types
MeSH terms
Substances
Grants and funding
LinkOut - more resources
Full Text Sources
Other Literature Sources
