. 2000 Aug;157(2):435-48.
doi: 10.1016/S0002-9440(10)64556-7.

Osteoprotegerin ligand modulates murine osteoclast survival in vitro and in vivo

Affiliations

Osteoprotegerin ligand modulates murine osteoclast survival in vitro and in vivo

D L Lacey et al. Am J Pathol. 2000 Aug.

Abstract

Osteoprotegerin ligand (OPGL) targets osteoclast precursors and osteoclasts to enhance differentiation and activation, however, little is known about OPGL effects on osteoclast survival. In vitro, the combination of OPGL + colony-stimulating factor-1 (CSF-1) is required for optimal osteoclast survival. Ultrastructurally, apoptotic changes were observed in detached cells and culture lysates exhibited elevated caspase 3 activity, particularly in cultures lacking CSF-1. DEVD-FMK (caspase 3 inhibitor) partially protected cells when combined with OPGL, but not when used alone or in combination with CSF-1. CSF-1 maintained NF-kappaB activation and increased the expression of bcl-2 and bcl-X(L) mRNA, but had no effect on JNK activation. In contrast, OPGL enhanced both NF-kappaB and JNK kinase activation and increased the expression of c-src, but not bcl-2 and bcl-X(L) mRNA. These data suggest that aspects of both OPGL's and CSF-1's signaling/survival pathways are required for optimal osteoclast survival. In mice, a single dose of OPG, the OPGL decoy receptor, led to a >90% loss of osteoclasts because of apoptosis within 48 hours of exposure without impacting osteoclast precursor cells. Therefore, OPGL is essential, but not sufficient, for osteoclast survival and endogenous CSF-1 levels are insufficient to maintain osteoclast viability in the absence of OPGL.


Figures

Figure 1.
Figure 1.
OPGL and CSF-1 effects on in vitro osteoclast survival. Osteoclasts were developed in vitro from bone marrow cells using media supplemented with CSF-1 and OPGL as described. After 5 to 6 days, large osteoclast-like cells were obvious by phase contrast microscopy and the wells were rinsed and the media replaced with medium alone, CSF-1 (30 ng/ml), OPGL alone (100 ng/ml), or CSF-1 + OPGL (100 ng/ml). Wells were stained for TRAP activity at T = 0 and at 6, 12, and 24 hours (h) after the media was changed. A: Representative photomicrographs of the various conditions taken at the indicated times are shown. Scale bars, 200 μm. B: Osteoclasts were counted in triplicate wells in the various conditions and the results normalized to the number present at time = 0, which was 253 ± 19. The results from three separate experiments were pooled and the data represent the mean ± SD, n = 9. Note that the combination of CSF-1 + OPGL maintains osteoclast numbers at starting levels throughout the 24-hour observation period.
Figure 2.
Figure 2.
Figure 2. ▶ Cyto- and ultrastructural morphology of degenerating cells in culture supernatants from osteoclast cultures. Osteoclast cultures were established and manipulated as described in Figure 1 ▶ . Supernatants were collected and cytospins were prepared. Large multinucleated cells with intact nuclei (by light microscopy), large cells with fragmented nuclear debris, and large spherical cell fragments with no apparent nuclei were observed in culture supernatants and are indicated as type 1 (B), type 2 (C), and type 3 cells (D), respectively. The scale bar in D represents 50 μm and applies to B–D. These three types were quantitated across three experiments, combined and are presented in A as the mean ± SD (n = 9). The error bar represents the SD of the summed events. Note that the media alone and OPGL alone groups had the highest level of detached cells with degenerative changes and that these debris were increased as early as 6 hours when compared to CSF-1 + OPGL. E: A toluidine blue, 1-μm plastic section of supernatant osteoclasts with apoptotic features are shown. The supernatant came from an osteoclast culture 6 hours after being placed in basal media. F: An electron micrograph of a viable osteoclast harvested from the culture membrane surface at the time of media changing is shown. G–I: Osteoclasts with a progression of apoptotic features are shown. G: A cell with nuclear chromatin condensation and margination together with cell membrane blebbing is shown. H: A cell with more extensive chromatin condensation and margination, loss of membrane blebs, and more extensive cytoplasmic vacuolization is shown. I: A cell with extensive nuclear fragmentation is shown. The features shown in G–I were from cells in E. The scale bars in E and I represent 25 and 2 μm, respectively, and the scale bar in I applies to F–I.
Figure 3.
Figure 3.
Caspase involvement in osteoclast apoptosis. A: Osteoclast culture RNA was screened for caspase mRNA by RNase protection assay as described in the Methods. The bands representing specifically expressed caspase mRNAs are indicated. B: Osteoclast lysates were obtained at time = 0 and at the indicated times after media exchange and assayed for caspase 3-like activity using DEVD-AFC. Caspase activity is expressed as the rate of substrate cleavage normalized to protein amount. The values were pooled from two experiments (n = 6) and represent the mean ± SD. C: Osteoclast lysates from the various conditions taken at the indicated times were assessed for procaspase 3 protein by Western blot analysis. The lane labeled “C” is the RSV-3T3 lysate provided by the manufacturer as a control. Densitometry values are below each lane and are expressed as a percent of the T = 0 value. D: Osteoclast cultures were developed as described and the media were exchanged and replaced with CSF-1 (30 ng/ml), OPGL (100 ng/ml), DEVD-FMK (100 μM), zVAD-FMK (100 μM), or the indicated combinations. Twenty-four hours later osteoclast numbers were obtained and then normalized to the starting number and expressed as the percentage of the starting osteoclast number which was 200 ± 54. The values were pooled from two experiments (n = 6) and represent the mean ± SD. Osteoclasts express a range of different caspases and lysate analysis show that caspase 3 activation occurs in osteoclasts not containing both CSF-1 and OPGL. Western blot analysis shows disappearance of procaspase 3 consistent with activation, particularly in the media- and OPGL-alone conditions. Caspase inhibition preserves osteoclast viability when combined with OPGL.
Figure 4.
Figure 4.
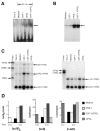
CSF-1 and OPGL effects on NF-κB and JNK kinase activation and bcl-2, bcl-XL, and c-src mRNA expression in osteoclast cultures. In vitro osteoclast cultures were established as described in Figure 1 ▶ . For NF-κB (A) and JNK kinase (B) activation studies, osteoclast cultures were rinsed and then exposed to basal media, OPGL (100 ng/ml), CSF-1 (30 ng/ml), or their combination for 30 minutes. A: An electrophoretic mobility shift assay using 32P-labeled double-stranded oligonucleotides containing NF-κB consensus sequences is shown. B: JNK immunoprecipitates from the osteoclast cultures were assayed for kinase activity using GST-JUN as a substrate and they were resolved by sodium dodecyl sulfate-polyacrylamide gel electrophoresis. For bcl-2, bcl-XL, and c-src mRNA expression total cell RNA was isolated at time = 0 and 4 hours after the media were changed. RNase protection assays were performed. C: Phosphorimages show the effect of the various treatments on bcl-2, bcl-XL (left) and c-src mRNA expression (right). Quantitative analysis of relative expression levels (normalized to cyclophilin) is shown in D. Note that CSF-1 increases NF-κB activation and bcl-XL and bcl-2 mRNA expression and that OPGL increases both NF-κB and JNK kinase activation and c-src mRNA expression in these cultures.
Figure 5.
Figure 5.
Quantitative histomorphometry of viable and apoptotic osteoclasts in mice treated with OPGL and OPG. Mice were treated with either saline or OPGL (1 mg/kg, SC) for 1 week then, 3 hours after the last injection, a single dose of OPG (10 mg/kg, i.v.) or saline was administered. Histological sections of the distal femur stained by cathepsin K immunohistochemistry from mice sacrificed at 0, 6, 12, 24, and 48 hours after the OPG injection were assessed for viable (A) and apoptotic (B) osteoclasts. Both measures are expressed as events/tissue area (mm2) and the data shown are the mean ± SD (n = 5 animals/group). Different from saline → saline group: *, P < 0.05, **, P < 0.01; different from OPGL → saline group: ##, P < 0.01.
Figure 6.
Figure 6.
Histology of osteoclasts and apoptotic debris in mice treated with OPGL and OPG. Mice were treated with OPGL and OPG as described in Figure 5 ▶ . Sections of proximal tibiae were prepared and stained by cathepsin K immunohistochemistry. The immunosections were developed using an alkaline phosphatase substrate (Biotek red), the product of which fluoresces on ultraviolet light exposure. A–F: Cathepsin K-immunostained sections of bone from mice treated as follows are shown: saline (7 days) (A); OPGL (1 mg/kg, 7 days) (B); saline (7 days) → saline (single intravenous dose) → 48 hours (C); OPGL (7 days) → saline (single intravenous dose) → 48 hours (D); saline (7 days) → OPG (10 mg/kg, single intravenous dose) → 48 hours (E); and OPGL (7 days) → OPG (10 mg/kg, single intravenous dose) → 48 hours (F). In all cases (A–F), the photomicrographs show the junction of the hypertrophic region of the growth plate (denoted by *) with the primary spongiosa. The fluorescent large orange/red, cathepsin K-positive cells (arrowheads) are osteoclasts. The scale bar in F (applies to A–F) represents 100 μm.
Figure 7.
Figure 7.
OPG causes osteoclast apoptosis in vivo. Mice were treated with OPGL (1 mg/kg, 7 days) as described in Figure 5 ▶ and then injected intravenously with a single OPG dose (10 mg/kg) or saline as a control. Tibiae were collected 12 hours after injection and decalcified sections were processed for cathepsin K immunohistochemistry. A: Two examples of osteoclasts from bones of saline-treated OPGL-exposed mice are shown. Note the nuclear and cytoplasmic appearance of intact osteoclasts that are closely opposed to bone matrix. B: Two examples of osteoclasts from bones of OPG-treated OPGL-exposed mice are shown. Note that the cells have retracted from the bone surface, are shrunken, and exhibit nuclear changes consistent with apoptosis. The scale bar in B represents 10 μm.
Figure 8.
Figure 8.
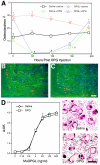
Effects of OPG treatment on osteoclast recovery in vivo and osteoclast precursors in vitro. Mice were treated as in Figure 5 ▶ except that mice were analyzed at 0, 48, 96, 144, and 192 hours after a single injection of saline or OPG. A: Quantitative histomorphometry of cathepsin K-immunostained sections of distal femur were analyzed for osteoclast numbers as described in Figure 5 ▶ . Different from saline → saline group, *P < 0.01; different from OPGL → saline group, #, P < 0.01. Histological sections of the proximal tibiae stained with cathepsin K antibodies from saline → saline treated or OPGL → OPG treated mice are shown in B and C, respectively. The scale bar represents 100 μm. Note that osteoclast numbers recover between 144 and 192 hours after OPG exposure and that the osteoclasts re-appear in the same anatomical locations in the OPG-treated animals as they are observed in the saline-treated animals. D: For osteoclast precursor analysis, bone marrow from mice treated with either saline or OPG were used in the in vitro osteoclast forming assay. The left panel shows the result of the TRAP solution assay (mean ± SD of A405 values from triplicate cultures) and the right panels show the cytomorphology of TRAP-stained cultures that were differentiated with CSF-1 (30 ng/ml) and OPGL (100 ng/ml). The labels “saline” and “OPG” reflect the in vivo treatments of the mice before bone marrow isolation and the scale bar represents 200 μm. Note that in vivo OPG exposure has no inhibitory effects on the ability of bone marrow osteoclast precursors to differentiate into osteoclasts in vitro.

Similar articles

Cited by

References

    1. Chambers TJ: The cellular basis of bone resorption. Clin Orthop 1980, 151:283-293 - PubMed
    1. Rodan GA, Martin TJ: Role of osteoblasts in hormonal control of bone resorption. Calcif Tissue Int 1981, 33:349-351 - PubMed
    1. Lacey DL, Timms E, Tan H-L, Kelley MJ, Dunstan CR, Burgess T, Elliott R, Colombero A, Elliott G, Scully S, Hsu H, Sullivan J, Hawkins N, Davy E, Capparelli C, Eli A, Qian Y-X, Kaufman S, Sarosi I, Shalhoub V, Senaldi V, Guo G, Delaney J, Boyle WJ: Osteoprotegerin ligand is a cytokine that regulates osteoclast differentiation and activation. Cell 1998, 93:165-176 - PubMed
    1. Shalhoub V, Faust J, Boyle WJ, Dunstan CR, Kelley M, Kaufman S, Scully S, Van G, Lacey DL: Osteoprotegerin and osteoprotegerin effects on osteoclast formation from peripheral blood mononuclear cell precursors. J Cell Biochem 1999, 72:251-261 - PubMed
    1. Yoshida H, Hayashi S-I, Kunisada T, Ogawa M, Nishikawa S, Okamura H, Sudo T, Shultz LD, Nishikawa S-I: The murine mutation osteopetrosis is in the coding region of the macrophage colony stimulating factor gene. Nature 1990, 345:442-444 - PubMed

MeSH terms