. 2000 Aug 7;192(3):405-12.
doi: 10.1084/jem.192.3.405.

Human monocyte-derived dendritic cells induce naive T cell differentiation into T helper cell type 2 (Th2) or Th1/Th2 effectors. Role of stimulator/responder ratio

Affiliations

Human monocyte-derived dendritic cells induce naive T cell differentiation into T helper cell type 2 (Th2) or Th1/Th2 effectors. Role of stimulator/responder ratio

H Tanaka et al. J Exp Med. .

Abstract

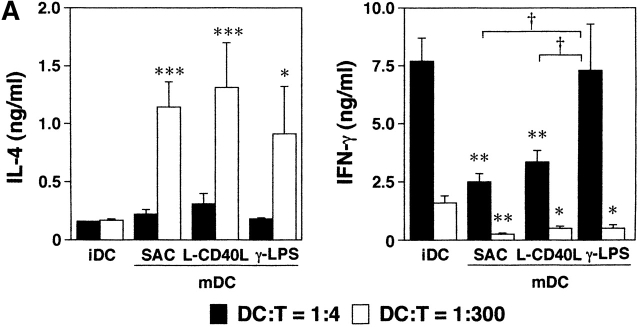
The subset of dendritic cells (DCs) and the nature of the signal inducing DC maturation determine the capacity of DCs to generate polarized immune responses. In this study, we show that the ability of human monocyte-derived DCs (myeloid DC(1)) to promote T helper type 1 (Th1) or Th2 differentiation was also found to be critically dependent on stimulator/responder ratio. At a low ratio (1:300), mature DCs that have been differentiated after inflammatory (Staphylococcus aureus Cowan 1 or lipopolysaccharide) or T cell-dependent (CD40 ligand) stimulation induced naive T cells to become Th2 (interleukin [IL]-4(+), IL-5(+), interferon gamma) effectors. Th2 differentiation was dependent on B7-CD28 costimulation and enhanced by OX40-OX40 ligand interactions. However, high DC/T cell ratio (1:4) favored a mixed Th1/Th2 cell development. Thus, the fact that the same DC lineage stimulates polarized Th1 or Th2 responses may be relevant since it allows the antigen-presenting cells to initiate an appropriate response for the signal received at the peripheral sites. Controlling the number and the rate of DC migration to the T cell areas in lymphoid tissues may be important for the therapeutic use of DCs.


Figures

Figure 1
Figure 1
Cytokine production by activated myeloid DCs. IL-12 p70 and TNF-α secretion after 24 h activation of iDC with the indicated stimuli. Results are the mean values ± SEM of at least three independent experiments. The number of separate experiments is indicated in parenthesis.
Figure 2
Figure 2
Myeloid DC promotes Th2 development at 1:300 DC/T ratio and favors Th1/Th2 at 1:4 ratio. Human naive CD4+ T cells were cocultured for 4 d with allogeneic mDCs at low (1:300) or high (1:4) stimulator/responder ratio. After IL-2 expansion, T cells were counted and restimulated with anti-CD3 immobilized on L-CD32/B7 transfectants (A) or with PMA and ionomycin for 5 h (B). (A) IL-4 and IFN-γ were measured in 24- or 48-h culture supernatant, respectively, by ELISA or RIA. Data are the mean values of at least four experiments ± SEM (statistical analysis, *mDCs vs. immature DCs, γ-LPS vs. other mDCs). Similar results were obtained after PMA and ionomycin stimulation. (B) 104 cells were analyzed by flow cytometry for IL-4 and IFN-γ expression, and the percentage of positive cells is indicated in the quadrants. Data are one experiment representative of two independent experiments.
Figure 2
Figure 2
Myeloid DC promotes Th2 development at 1:300 DC/T ratio and favors Th1/Th2 at 1:4 ratio. Human naive CD4+ T cells were cocultured for 4 d with allogeneic mDCs at low (1:300) or high (1:4) stimulator/responder ratio. After IL-2 expansion, T cells were counted and restimulated with anti-CD3 immobilized on L-CD32/B7 transfectants (A) or with PMA and ionomycin for 5 h (B). (A) IL-4 and IFN-γ were measured in 24- or 48-h culture supernatant, respectively, by ELISA or RIA. Data are the mean values of at least four experiments ± SEM (statistical analysis, *mDCs vs. immature DCs, γ-LPS vs. other mDCs). Similar results were obtained after PMA and ionomycin stimulation. (B) 104 cells were analyzed by flow cytometry for IL-4 and IFN-γ expression, and the percentage of positive cells is indicated in the quadrants. Data are one experiment representative of two independent experiments.
Figure 4
Figure 4
Th2 differentiation is dependent on B7–CD28 costimulation and OX40–OX40L interactions. Human naive CD4+ T cells were cocultured with allogeneic mDCs at different stimulator/responder ratios in the presence of control Ab, anti–IL-12 mAb (10 μg/ml), or anti–IL-4 plus anti–IL-4R Abs (5 μg/ml each) (A), and NHIg-Fc or CTLA-4–FC (5 μg/ml) (B). After IL-2 expansion, T cells were counted and restimulated with PMA and ionomycin for 5 h and stained as in the legend to Fig. 2. Data are representative of at least two independent experiments. (C) Naive T cells were cocultured with SAC-activated allogeneic DCs at 1:300 ratio in the presence of anti-CD40L, anti-OX40L, respective control mAbs (10 μg/ml) (IgG2a or IgG1), NHIg-Fc, or CTLA-4–Fc (5 μg/ml). After IL-2 expansion, T cells were restimulated with anti-CD3 immobilized on L-CD32/B7 transfectants. After 24–48 h, cytokine release was measured as in the legends to Fig. 2 and Fig. 3. Data are the mean values ± SEM of at least four independent experiments.
Figure 4
Figure 4
Th2 differentiation is dependent on B7–CD28 costimulation and OX40–OX40L interactions. Human naive CD4+ T cells were cocultured with allogeneic mDCs at different stimulator/responder ratios in the presence of control Ab, anti–IL-12 mAb (10 μg/ml), or anti–IL-4 plus anti–IL-4R Abs (5 μg/ml each) (A), and NHIg-Fc or CTLA-4–FC (5 μg/ml) (B). After IL-2 expansion, T cells were counted and restimulated with PMA and ionomycin for 5 h and stained as in the legend to Fig. 2. Data are representative of at least two independent experiments. (C) Naive T cells were cocultured with SAC-activated allogeneic DCs at 1:300 ratio in the presence of anti-CD40L, anti-OX40L, respective control mAbs (10 μg/ml) (IgG2a or IgG1), NHIg-Fc, or CTLA-4–Fc (5 μg/ml). After IL-2 expansion, T cells were restimulated with anti-CD3 immobilized on L-CD32/B7 transfectants. After 24–48 h, cytokine release was measured as in the legends to Fig. 2 and Fig. 3. Data are the mean values ± SEM of at least four independent experiments.
Figure 3
Figure 3
Cytokine profile of effectors primed at 1:4 and 1:300 ratios. Human naive CD4+ T cells were cocultured for 4 d with allogeneic iDCs or mDCs at low and high density ratio, expanded in IL-2, and restimulated with anti-CD3 immobilized on L-CD32/B7 transfectants. IL-2, IL-5, IL-10, and IL-13 were measured by ELISA or RIA in culture supernatants after 24 h (reference 15). Data are the mean values ± SEM of at least four independent experiments.

References

    1. Openshaw P., Murphy E.E., Hosken N.A., Maino V., Davis K., Murphy K., O'Garra A. Heterogeneity of intracellular cytokine synthesis at the single-cell level in polarized T helper 1 and T helper 2 populations. J. Exp. Med. 1995;182:1357–1367. - PMC - PubMed
    1. Tao X., Constant S., Jorritsma P., Bottomly K. Strength of TCR signal determines the costimulatory requirements for Th1 and Th2 CD4+ T cell differentiation. J. Immunol. 1997;159:5956–5963. - PubMed
    1. Tao X., Grant C., Constant S., Bottomly K. Induction of IL-4-producing CD4+ T cells by antigenic peptides altered for TCR binding. J. Immunol. 1997;158:4237–4244. - PubMed
    1. Delespesse G., Ohshima Y., Shu U., Yang L.-P., Demeure C., Wu C.-Y., Byun D.-G., Sarfati M. Differentiation of naive human CD4 T cells into Th2/Th1 effectors. Allergol. Int. 1997;46:63–72.
    1. Banchereau J., Steinman R.M. Dendritic cells and the control of immunity. Nature. 1998;392:245–252. - PubMed

Publication types

MeSH terms