. 2000 Aug 7;192(3):421-32.
doi: 10.1084/jem.192.3.421.

A second leukotriene B(4) receptor, BLT2. A new therapeutic target in inflammation and immunological disorders

Affiliations

A second leukotriene B(4) receptor, BLT2. A new therapeutic target in inflammation and immunological disorders

T Yokomizo et al. J Exp Med. .

Abstract

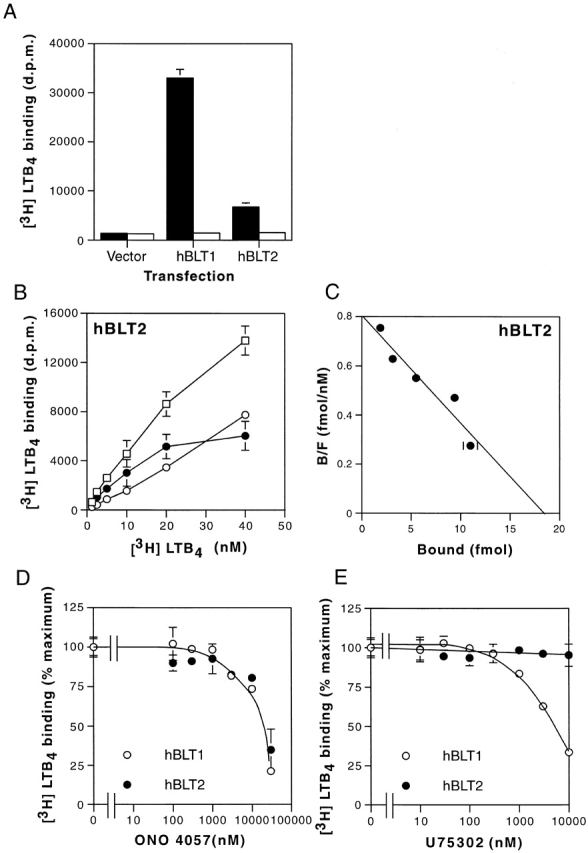
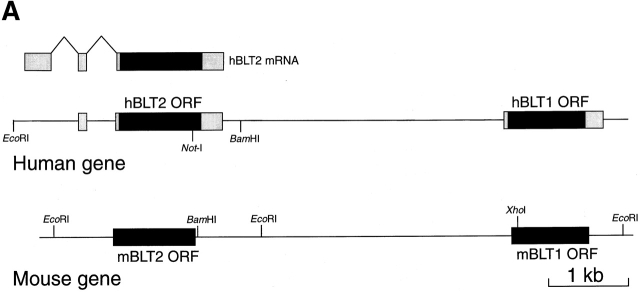
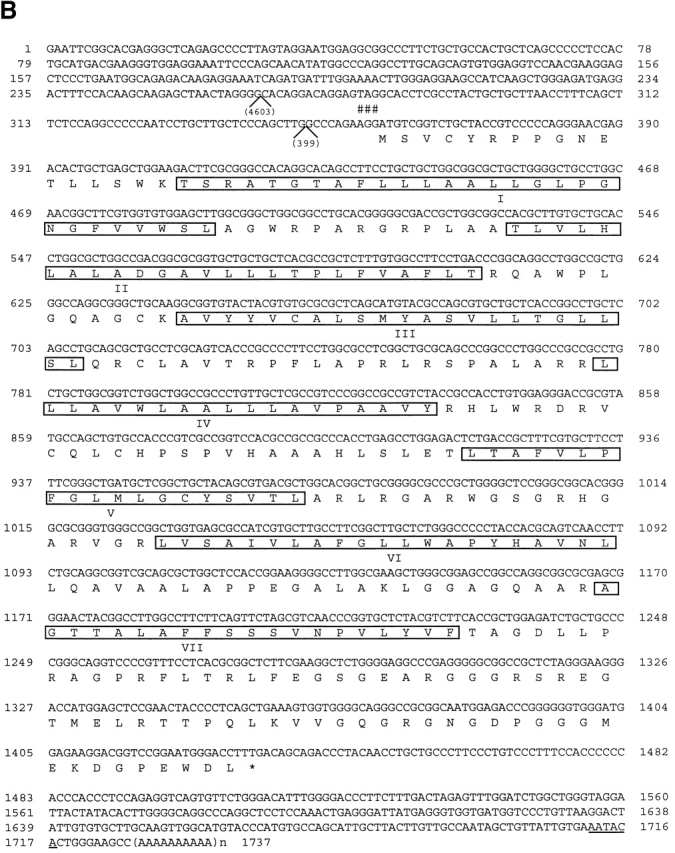
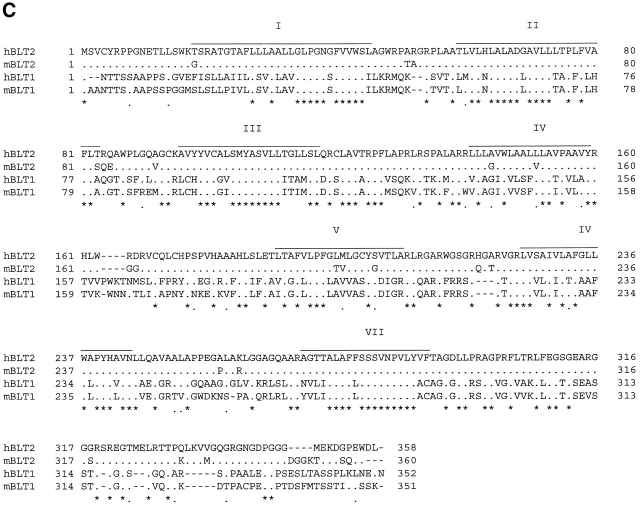
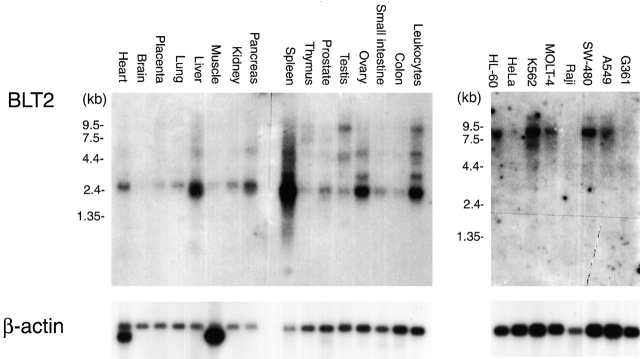
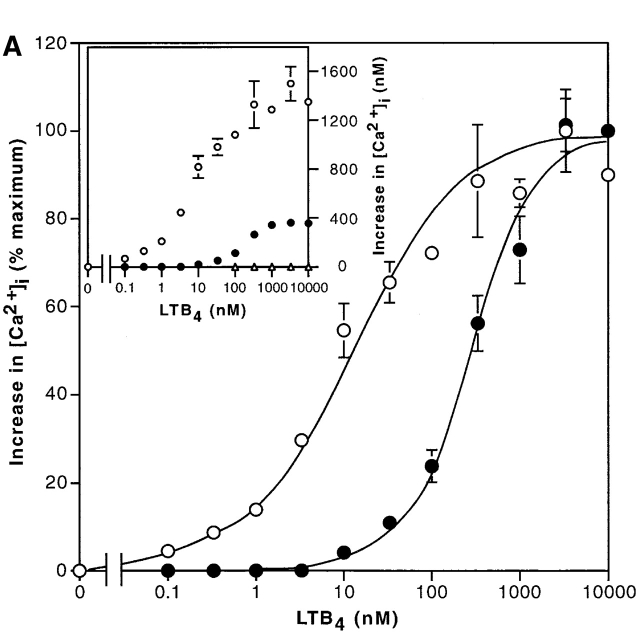
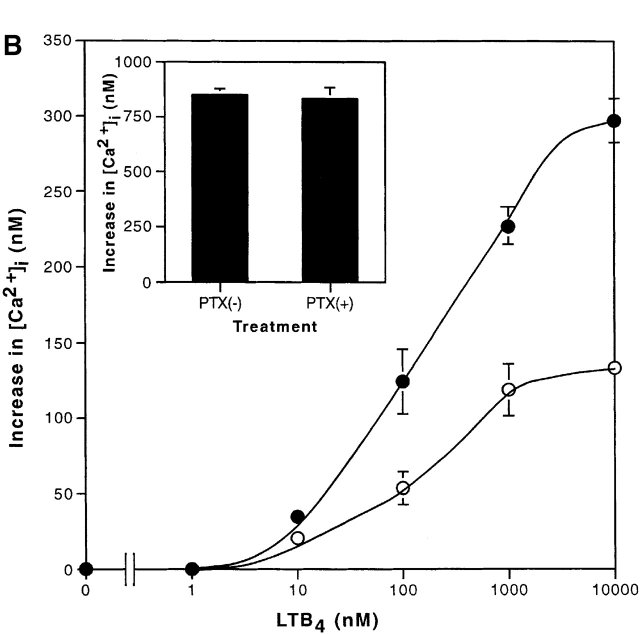
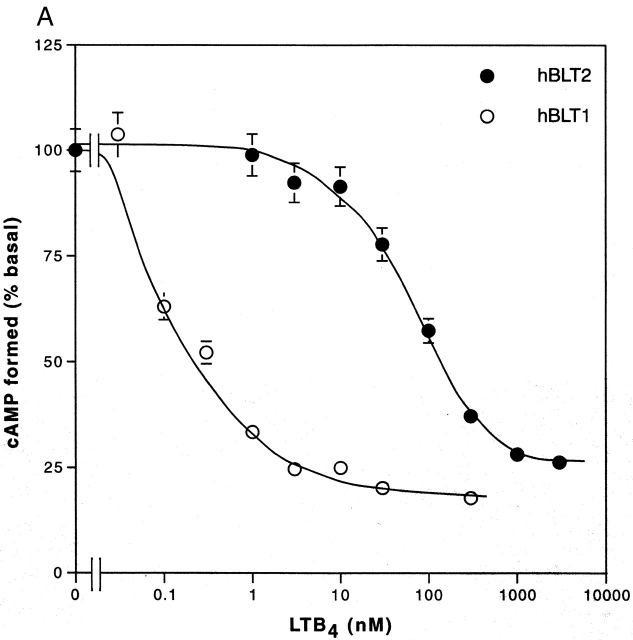
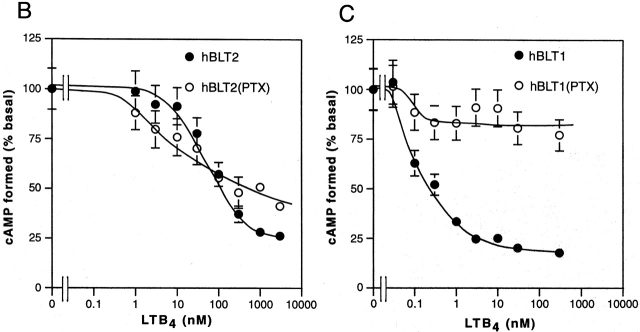
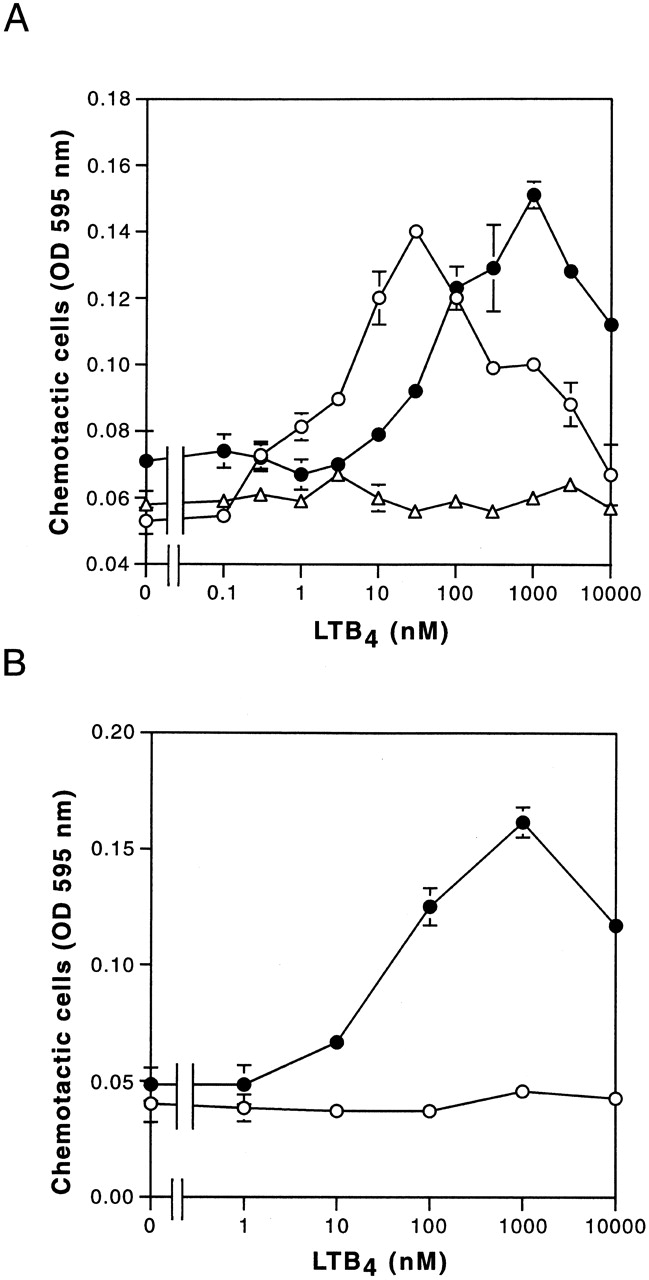
Leukotriene B(4) (LTB(4)) is a potent chemoattractant and activator of both granulocytes and macrophages. The actions of LTB(4) appear to be mediated by a specific G protein-coupled receptor (GPCR) BLT1, originally termed BLT (Yokomizo, T., T. Izumi, K. Chang, Y. Takuwa, and T. Shimizu. 1997. Nature. 387:620-624). Here, we report the molecular cloning of a novel GPCR for LTB(4), designated BLT2, which binds LTB(4) with a Kd value of 23 nM compared with 1.1 nM for BLT1, but still efficiently transduces intracellular signaling. BLT2 is highly homologous to BLT1, with an amino acid identity of 45.2%, and its open reading frame is located in the promoter region of the BLT1 gene. BLT2 is expressed ubiquitously, in contrast to BLT1, which is expressed predominantly in leukocytes. Chinese hamster ovary cells expressing BLT2 exhibit LTB(4)-induced chemotaxis, calcium mobilization, and pertussis toxin-insensitive inhibition of adenylyl cyclase. Several BLT1 antagonists, including U 75302, failed to inhibit LTB(4) binding to BLT2. Thus, BLT2 is a pharmacologically distinct receptor for LTB(4), and may mediate cellular functions in tissues other than leukocytes. BLT2 provides a novel target for antiinflammatory therapy and promises to expand our knowledge of LTB(4) function. The location of the gene suggests shared transcriptional regulation of these two receptors.


Figures

Figure 3
Figure 3
Binding of 3H–LTB4 to the membrane fractions of HEK 293 cells transiently transfected with hBLT1 or hBLT2. (A) Binding of 5 nM 3H–LTB4 to the membrane fractions (20 μg of protein) from HEK 293 cells transfected with control vector (Vector), BLT1 expression vector (hBLT1), or BLT2 expression vector (hBLT2). Total binding (black columns) and nonspecific binding (white columns) are presented (mean ± SD, n = 3). d.p.m., disintegration per minute. (B and C) Binding isotherms (B) and Scatchard analysis (C) of 3H–LTB4 binding to membrane fractions of HEK 293 cells transfected with hBLT2. In B, total binding (□), nonspecific binding (○), and specific binding (•) are presented (mean ± SD, n = 3). (D and E) Inhibition of 5 nM 3H–LTB4 binding to the membrane fractions (20 μg of protein) of HEK 293 cells transfected with hBLT2 (•) or hBLT1 (○) by two BLT antagonists, (F) ONO 4057 and (G) U 75302 (mean ± SD, n = 3).
Figure 1
Figure 1
Cloning of human and mouse BLT2. (A) Structures of human and mouse genomic DNAs containing BLT1 and BLT2. In the human gene, transcribed segments are indicated by open boxes, and putative ORFs are indicated by filled boxes. (B) Primary structure of hBLT2 cDNA and deduced amino acid sequence. Putative TMs are boxed. An in-frame-stop codon (TAG) is indicated by number signs at the 5′ untranslated region of the putative ORF. The positions of introns are shown by the nucleotide numbers of introns. The incomplete polyadenylation signal (AATACA) is underlined. (C) Sequence alignment of BLT1 and BLT2 from humans and mice. Asterisks indicate amino acids conserved among four receptors. Dots indicate amino acids conserved among three receptors. The putative TMs of hBLT2 predicted from a Kyte-Doolittle hydrophobicity analysis are lined and labeled as I–VII. These sequence data are available from EMBL/GenBank/DDBJ under accession nos. AB029892 and AB029893.
Figure 1
Figure 1
Cloning of human and mouse BLT2. (A) Structures of human and mouse genomic DNAs containing BLT1 and BLT2. In the human gene, transcribed segments are indicated by open boxes, and putative ORFs are indicated by filled boxes. (B) Primary structure of hBLT2 cDNA and deduced amino acid sequence. Putative TMs are boxed. An in-frame-stop codon (TAG) is indicated by number signs at the 5′ untranslated region of the putative ORF. The positions of introns are shown by the nucleotide numbers of introns. The incomplete polyadenylation signal (AATACA) is underlined. (C) Sequence alignment of BLT1 and BLT2 from humans and mice. Asterisks indicate amino acids conserved among four receptors. Dots indicate amino acids conserved among three receptors. The putative TMs of hBLT2 predicted from a Kyte-Doolittle hydrophobicity analysis are lined and labeled as I–VII. These sequence data are available from EMBL/GenBank/DDBJ under accession nos. AB029892 and AB029893.
Figure 2
Figure 2
Northern blot analyses of BLT2 mRNA in various human tissues and cells. Human multiple-tissue Northern blot filters (2 μg poly-A RNA/lane; CLONTECH Laboratories, Inc.) were hybridized with [32P]dCTP-labeled ORF of hBLT2 or human β-actin cDNA (CLONTECH Laboratories, Inc.).
Figure 4
Figure 4
Calcium mobilization in CHO-hBLT1 and CHO-hBLT2 cells by LTB4. (A) Increases in intracellular calcium after exposure to various concentrations of LTB4 were measured in CHO-hBLT1 (○) and CHO-hBLT2 (•) cells, and were represented as percentages of the maximum responses. The inset graph shows absolute values of increase in intracellular calcium concentrations (mean ± SD, n = 3). (B) Effects of PTX pretreatment on LTB4-induced increases in intracellular calcium concentrations in CHO-hBLT2 cells. The cells were pretreated with 100 ng/ml PTX (○) or vehicle (•) for 12 h. The inset shows increases in intracellular calcium concentrations, evoked by 2 U/ml thrombin, that were not affected by PTX pretreatment (mean ± SD, n = 3).
Figure 4
Figure 4
Calcium mobilization in CHO-hBLT1 and CHO-hBLT2 cells by LTB4. (A) Increases in intracellular calcium after exposure to various concentrations of LTB4 were measured in CHO-hBLT1 (○) and CHO-hBLT2 (•) cells, and were represented as percentages of the maximum responses. The inset graph shows absolute values of increase in intracellular calcium concentrations (mean ± SD, n = 3). (B) Effects of PTX pretreatment on LTB4-induced increases in intracellular calcium concentrations in CHO-hBLT2 cells. The cells were pretreated with 100 ng/ml PTX (○) or vehicle (•) for 12 h. The inset shows increases in intracellular calcium concentrations, evoked by 2 U/ml thrombin, that were not affected by PTX pretreatment (mean ± SD, n = 3).
Figure 5
Figure 5
Cyclic AMP accumulation in forskolin-treated CHO-hBLT1 and CHO-hBLT2 cells. (A) LTB4 inhibits 50 μM forskolin–induced adenylyl cyclase activities in both CHO-hBLT1 (○) and CHO-hBLT2 (•) cells. Forskolin-induced cAMP levels in the absence of LTB4 were 44.2 ± 4.5 pmol/well in CHO-hBLT2 and 112.0 ± 11.8 pmol/well in CHO-hBLT1 cells (mean ± SE, n = 4). (B) The effects of PTX pretreatment (100 ng/ml, 12 h) on cAMP accumulation in CHO-hBLT2 cells. The 50 μM forskolin–induced cAMP levels in the absence of LTB4 were 44.2 ± 4.5 pmol/well in untreated cells and 48.3 ± 4.9 pmol/well in PTX-treated cells (mean ± SE, n = 4). (C) The effects of PTX pretreatment (100 ng/ml, 12 h) on cAMP accumulation in CHO-hBLT1 cells. The 50 μM forskolin–induced cAMP levels in the absence of LTB4 were 112.0 ± 11.8 pmol/well in untreated cells and 71.0 ± 7.3 pmol/well in PTX-treated cells (mean ± SE, n = 4).
Figure 5
Figure 5
Cyclic AMP accumulation in forskolin-treated CHO-hBLT1 and CHO-hBLT2 cells. (A) LTB4 inhibits 50 μM forskolin–induced adenylyl cyclase activities in both CHO-hBLT1 (○) and CHO-hBLT2 (•) cells. Forskolin-induced cAMP levels in the absence of LTB4 were 44.2 ± 4.5 pmol/well in CHO-hBLT2 and 112.0 ± 11.8 pmol/well in CHO-hBLT1 cells (mean ± SE, n = 4). (B) The effects of PTX pretreatment (100 ng/ml, 12 h) on cAMP accumulation in CHO-hBLT2 cells. The 50 μM forskolin–induced cAMP levels in the absence of LTB4 were 44.2 ± 4.5 pmol/well in untreated cells and 48.3 ± 4.9 pmol/well in PTX-treated cells (mean ± SE, n = 4). (C) The effects of PTX pretreatment (100 ng/ml, 12 h) on cAMP accumulation in CHO-hBLT1 cells. The 50 μM forskolin–induced cAMP levels in the absence of LTB4 were 112.0 ± 11.8 pmol/well in untreated cells and 71.0 ± 7.3 pmol/well in PTX-treated cells (mean ± SE, n = 4).
Figure 6
Figure 6
LTB4-induced cell migration in CHO-hBLT1 and CHO-hBLT2 cells. (A) Dose dependency of LTB4-induced cell migration was measured in CHO-hBLT1 (○), CHO-hBLT2 (•), and CHO vector (▵) cells (mean ± SE, n = 4). (B) Effects of PTX pretreatment (100 ng/ml, 12 h) on LTB4-induced cell migration in CHO-hBLT2 cells (mean ± SE, n = 4).

Comment in

References

    1. Samuelsson B., Dahlén S.E., Lindgren J.Å., Rouzer C.A., Serhan C.N. Leukotrienes and lipoxinsstructures, biosynthesis, and biological effects. Science. 1987;237:1171–1176. - PubMed
    1. Shimizu T., Wolfe L.S. Arachidonic acid cascade and signal transduction. J. Neurochem. 1990;55:1–15. - PubMed
    1. Serhan C.N., Haeggstrom J.Z., Leslie C.C. Lipid mediator networks in cell signalingupdate and impact of cytokines. FASEB J. 1996;10:1147–1158. - PubMed
    1. Gaudreau R., Gouill C.L., Metaoui S., Lemire S., Stankova J., Rola-Pleszczynski M. Signalling through the leukotriene B4 receptor involves both alpha i and alpha 16, but not alpha q or alpha 11 G-protein subunits. Biochem. J. 1998;335:15–18. - PMC - PubMed
    1. Iversen L., Kragballe K., Ziboh V.A. Significance of leukotriene-A4 hydrolase in the pathogenesis of psoriasis. Skin. Pharmacol. 1997;10:169–177. - PubMed

Publication types

MeSH terms

Associated data