. 2000 Aug 7;192(3):439-46.
doi: 10.1084/jem.192.3.439.

BLTR mediates leukotriene B(4)-induced chemotaxis and adhesion and plays a dominant role in eosinophil accumulation in a murine model of peritonitis

Affiliations

BLTR mediates leukotriene B(4)-induced chemotaxis and adhesion and plays a dominant role in eosinophil accumulation in a murine model of peritonitis

A M Tager et al. J Exp Med. .

Abstract

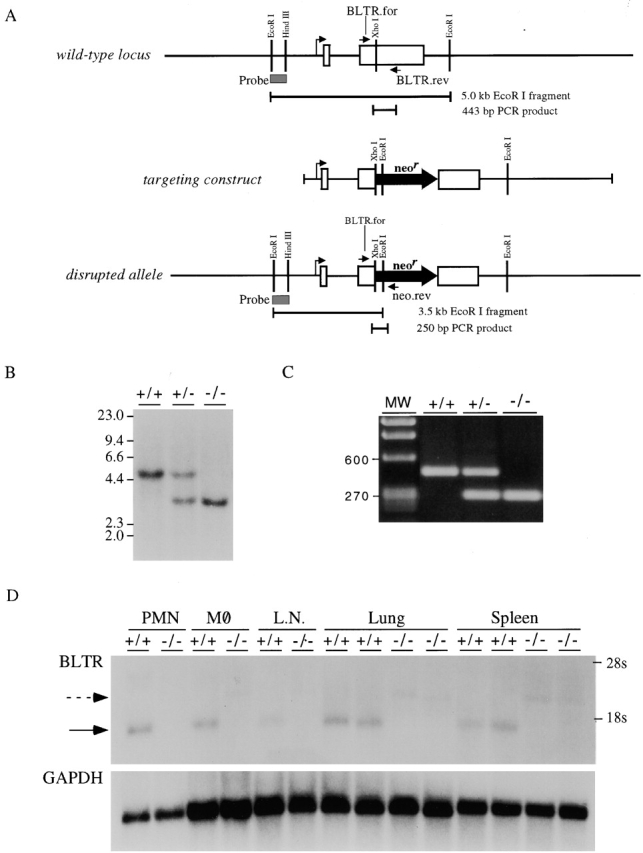
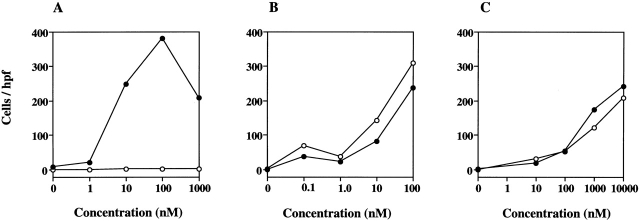
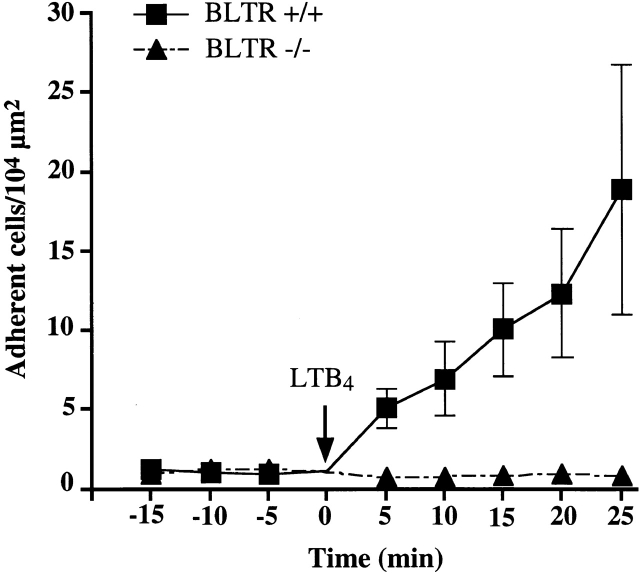
Leukotriene B(4) (LTB(4)) is a potent chemoattractant active on multiple leukocytes, including neutrophils, macrophages, and eosinophils, and is implicated in the pathogenesis of a variety of inflammatory processes. A seven transmembrane-spanning, G protein-coupled receptor, called BLTR (LTB(4) receptor), has recently been identified as an LTB(4) receptor. To determine if BLTR is the sole receptor mediating LTB(4)-induced leukocyte activation and to determine the role of LTB(4) and BLTR in regulating leukocyte function in inflammation in vivo, we generated a BLTR-deficient mouse by targeted gene disruption. This mouse reveals that BLTR alone is responsible for LTB(4)-mediated leukocyte calcium flux, chemotaxis, and firm adhesion to endothelium in vivo. Furthermore, despite the apparent functional redundancy with other chemoattractant-receptor pairs in vitro, LTB(4) and BLTR play an important role in the recruitment and/or retention of leukocytes, particularly eosinophils, to the inflamed peritoneum in vivo. These studies demonstrate that BLTR is the key receptor that mediates LTB(4)-induced leukocyte activation and establishes a model to decipher the functional roles of BLTR and LTB(4) in vivo.


Figures

Figure 1
Figure 1
Generation of BLTR−/− mice. (A) Schematic of wild-type locus, targeting construct, and disrupted allele. The two exons encoding BLTR in the wild-type locus are shown as open boxes. The EcoRI–HindIII fragment used as a probe in Southern blotting is indicated as a shaded box. This probe identifies a 5-kb fragment of the wild-type allele upon digestion with EcoRI. PCR using the primers BLTR.for and BLTR.rev, located as shown, generates a 443-bp PCR product. The targeting construct was made by inserting the 1.85-kb neomycin resistance cassette into the XhoI site in exon 2, resulting in 2.4 kb of genomic DNA 5′ to the neomycin resistance cassette and 13.6 kb 3′ to the cassette. The EcoRI–HindIII probe identifies a 3.5-kb fragment of the disrupted allele upon digestion with EcoRI. PCR using the primers BLTR.for and neo.rev, located as shown, generates a 250-bp PCR product from the disrupted allele. (B) Southern blot analysis. DNA from wild-type mice (+/+) and mice heterozygous (+/−) or homozygous (−/−) for the disrupted BLTR allele was digested with EcoRI and analyzed by Southern blotting using the probe indicated in A. Molecular weights (MW) in kilobases are displayed on the left of the blot. (C) Genomic PCR analysis. DNA from wild-type mice (+/+) and mice heterozygous (+/−) or homozygous (−/−) for the disrupted BLTR allele was analyzed by PCR using the primers indicated in A. Molecular weights (MW) in basepairs are displayed on the left of the gel. (D) Northern blot analysis. 5 μg of RNA from neutrophils (PMN), 10 μg from macrophages (MØ), and 20 μg from lymph nodes (L.N.), lungs, and spleens of wild-type and BLTR−/− mice were analyzed by Northern blotting using BLTR cDNA as a probe. The locations of 28S and 18S ribosomal RNA are displayed on the right of the blot. The previously described 1.45-kb BLTR transcript (solid arrow) was identified in wild-type mice but was absent in BLTR−/− mice, being replaced by a larger transcript (dashed arrow). This larger transcript, which resulted from the insertion of the neomycin resistance cassette in exon 2 of the BLTR gene, was detected at lower levels than the wild-type transcript, which is often seen for hybrid transcripts generated from gene-targeted alleles.
Figure 2
Figure 2
Calcium flux responses of wild-type and BLTR−/− leukocytes. Each tracing represents the intracellular [Ca2+] levels of fura-2–loaded peritoneal neutrophils (A) or macrophages (B) measured as relative fluorescence over time. Arrows mark the time of addition of the indicated agonists at optimal concentrations: LTB4 (167 nM), JE (20 nM), KC (20 nM), PAF (167 nM), MIP-1α (20 nM), and eotaxin (20 nM). The results shown are representative experiments (n = 3–4 for all cell types).
Figure 3
Figure 3
Chemotactic responses of wild-type (•) and BLTR−/− (○) bone marrow neutrophils to LTB4 (A), KC (B), and FMLP (C). Neutrophils were exposed to increasing concentrations of the indicated chemoattractants in a modified Boyden chamber, and the numbers of cells that migrated through the membrane were determined. Data are the number of cells per 400× field (hpf). The results shown are representative experiments (n = 3) and presented as the mean of eight fields counted from replicate wells.
Figure 4
Figure 4
Firm adhesion of wild-type and BLTR−/− leukocytes determined by intravital microscopy. Fluorescently labeled leukocytes in a representative venular tree (consisting of two to eight venular branches) were videotaped under epifluorescence illumination. Symbols represent the mean adherent leukocyte density as described in Materials and Methods. During a 15-min control period, CM preparations were superfused with sterile bicarbonate–buffered Ringer's injection solution, and baseline leukocyte adherence was assessed at least once. In some animals, baseline adherence was analyzed three times in 5-min intervals; no spontaneous changes in baseline rolling or adherence were observed (data not shown). At time point 0 min, the superfusion buffer was rapidly exchanged for Ringer's injection solution containing 100 nM LTB4, and leukocyte adherence was quantitated in the same venular tree at the indicated time points (n = 20 venules in four BLTR+/+ mice; n = 19 venules in three BLTR−/− mice)
Figure 5
Figure 5
Leukocyte recruitment in thioglycollate-induced peritonitis in wild-type (•) and BLTR−/− (○) mice. (A) Total numbers of leukocytes, eosinophils, neutrophils, and macrophages are presented as the mean number of these cells (±SE) obtained by peritoneal lavage at baseline and 4, 48, and 96 h after intraperitoneal injection of thioglycollate in 5–10 mice of each genotype. Cell type was determined by morphological analyses of Diff-Quik–stained cytocentrifuge preparations by an observer blinded to genotype. *P < 0.05; **P < 0.01; ***P < 0.005. (B) Percentages of peritoneal cells attributable to recruited eosinophils were confirmed by flow cytometric analysis at 48 and 96 h after thioglycollate injection. 25,000 events were analyzed for forward and side light scatter properties and for expression of mCCR3. Values represent the percentage of the total cell population that falls into the indicated region (R1). The broken line histogram indicates the isotype control; whereas the bold line histogram shows mCCR3 staining of the gated population (R1). These results are representative of four or five 6–10-wk-old mice of each genotype.
Figure 5
Figure 5
Leukocyte recruitment in thioglycollate-induced peritonitis in wild-type (•) and BLTR−/− (○) mice. (A) Total numbers of leukocytes, eosinophils, neutrophils, and macrophages are presented as the mean number of these cells (±SE) obtained by peritoneal lavage at baseline and 4, 48, and 96 h after intraperitoneal injection of thioglycollate in 5–10 mice of each genotype. Cell type was determined by morphological analyses of Diff-Quik–stained cytocentrifuge preparations by an observer blinded to genotype. *P < 0.05; **P < 0.01; ***P < 0.005. (B) Percentages of peritoneal cells attributable to recruited eosinophils were confirmed by flow cytometric analysis at 48 and 96 h after thioglycollate injection. 25,000 events were analyzed for forward and side light scatter properties and for expression of mCCR3. Values represent the percentage of the total cell population that falls into the indicated region (R1). The broken line histogram indicates the isotype control; whereas the bold line histogram shows mCCR3 staining of the gated population (R1). These results are representative of four or five 6–10-wk-old mice of each genotype.

Comment in

References

    1. Samuelsson B., Dahlen S.E., Lindgren J.A., Rouzer C.A., Serhan C.N. Leukotrienes and lipoxinsstructures, biosynthesis, and biological effects. Science. 1987;237:1171–1176. - PubMed
    1. Lewis R.A., Austen K.F., Soberman R.J. Leukotrienes and other products of the 5-lipoxygenase pathway. Biochemistry and relation to pathobiology in human diseases. N. Engl. J. Med. 1990;323:645–655. - PubMed
    1. Ford-Hutchinson A.W., Bray M.A., Doig M.V., Shipley M.E., Smith M. Leukotriene B4, a potent chemokinetic and aggregating substance released from polymorphonuclear leukocytes. Nature. 1980;286:264–265. - PubMed
    1. Ng C.F., Sun F.F., Taylor B.M., Wolin M.S., Wong P.Y.-K. Functional properties of guinea pig eosinophil leukotriene B4 receptor. J. Immunol. 1991;147:3096–3103. - PubMed
    1. Huang W.W., Garcia-Zepeda E.A., Sauty A., Oettgen H., Rothenberg M.E., Luster A.D. Molecular and biological characterization of the murine leukotriene B4 receptor expressed on eosinophils. J. Exp. Med. 1998;188:1063–1074. - PMC - PubMed

Publication types

MeSH terms