. 2000 Aug 15;20(16):5899-905.
doi: 10.1523/JNEUROSCI.20-16-05899.2000.

Developmental profile of the changing properties of NMDA receptors at cerebellar mossy fiber-granule cell synapses

Affiliations

Developmental profile of the changing properties of NMDA receptors at cerebellar mossy fiber-granule cell synapses

L Cathala et al. J Neurosci. .

Abstract

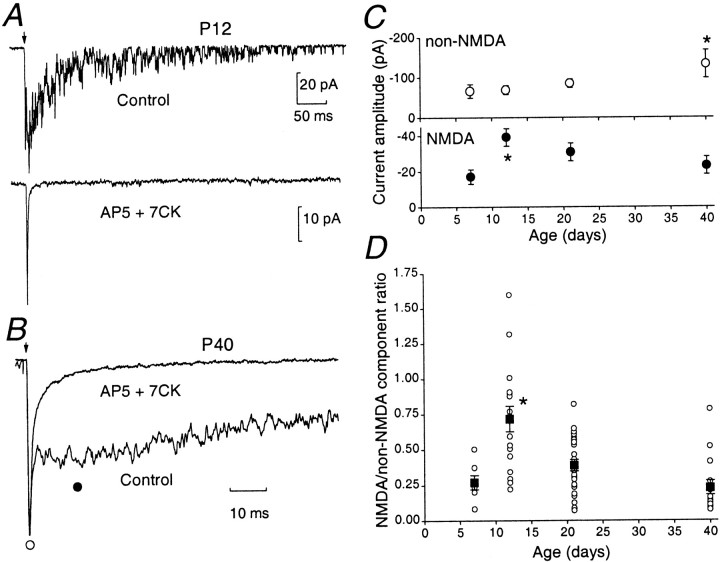
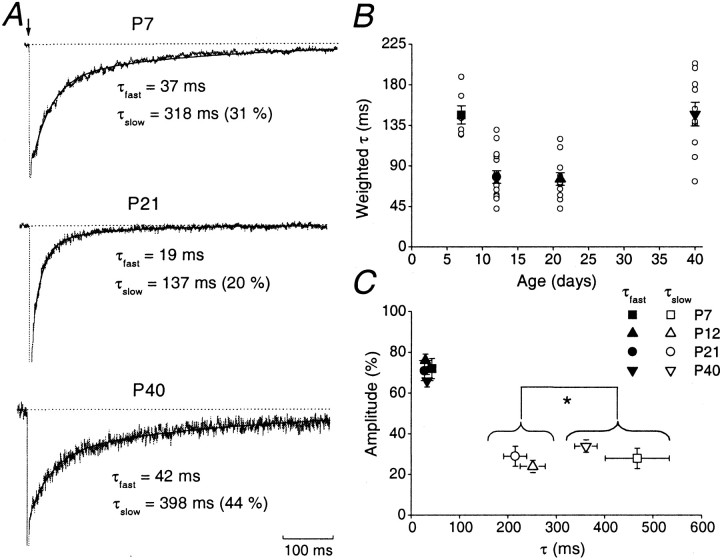
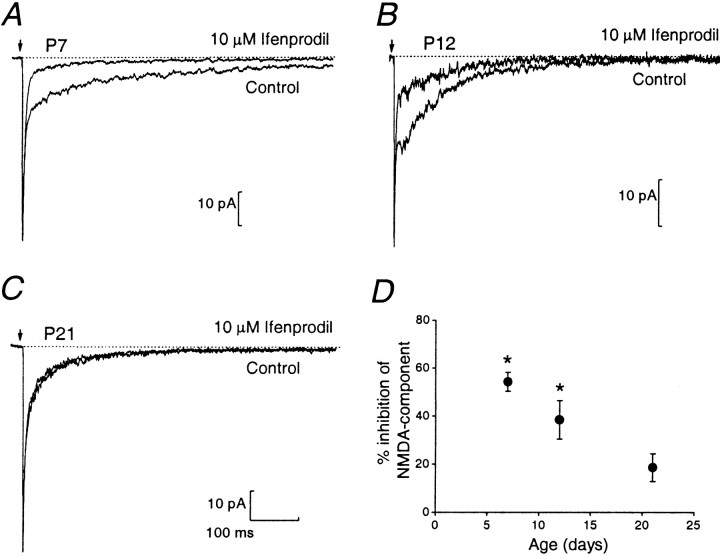
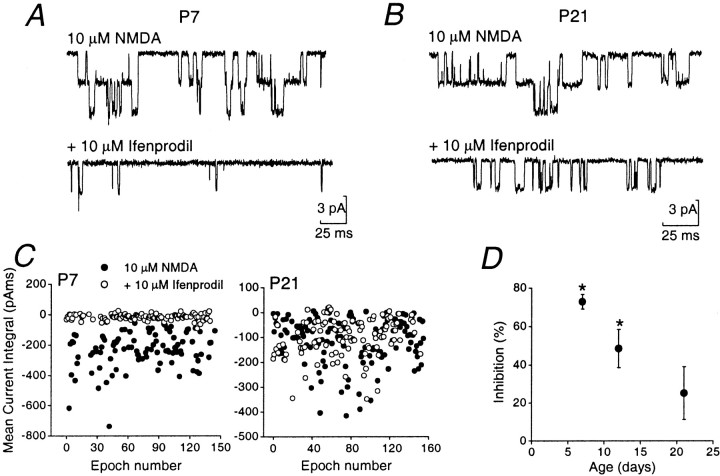
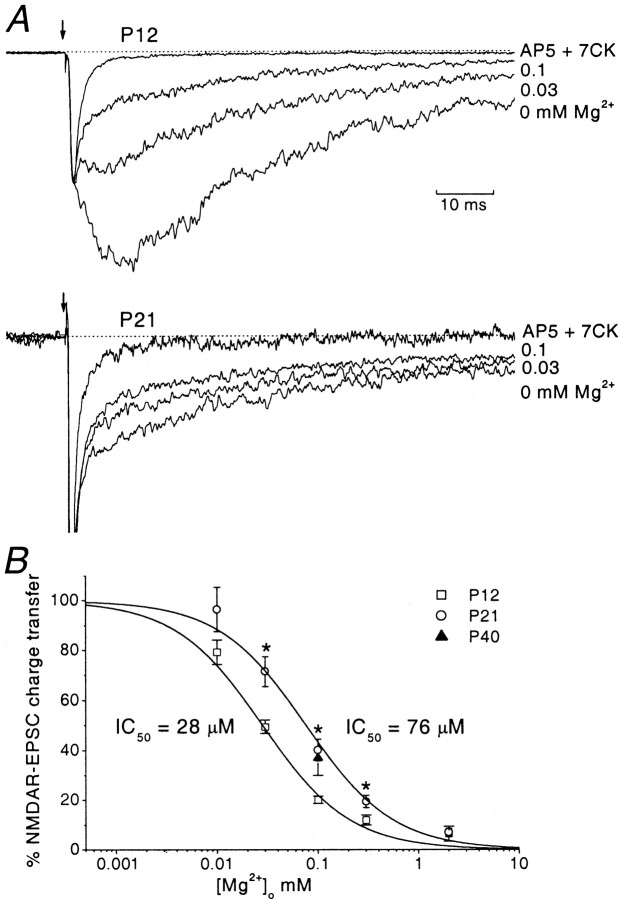
During cerebellar development, granule cells display well characterized changes in the expression of NMDA receptor (NMDAR) NR2 subunits, switching from NR2B to NR2A and NR2C in mature cells. Although various studies, including experiments on mutant mice with one or more NR2 subunit types deleted, suggest that NR2A, NR2B, and NR2C subunits contribute to synaptic NMDARs, changes in the properties of the mossy fiber EPSC during development have not been fully evaluated. In particular, information on NMDAR EPSCs in mature animals is lacking. We have examined pharmacological and kinetic properties of NMDARs at mossy fiber-granule cell synapses from their formation to maturity [postnatal day 7 (P7)-P40 rats]. Significant changes were seen in the relative amplitudes of the non-NMDAR- and NMDAR-mediated components of the evoked EPSC and in the decay kinetics of the latter. The NMDA/non-NMDA ratio was similar at P7, P21, and P40, but showed a clear peak at P12. This change coincided with a speeding of the NMDAR EPSC decay, accompanied by a decrease in sensitivity to ifenprodil (selective NR2B-antagonist). By P21, sensitivity of the NMDAR EPSC to Mg(2+) was approximately threefold less than that at P12 (IC(50), 76 vs 28 microm), suggesting incorporation of the NR2C subunit. However, the predicted slowing of decay kinetics to a value more characteristic of NR2C deactivation, was not seen until P40. Our data are consistent with the known switch from NR2B to NR2A subunits during the first two postnatal weeks, but suggest a gradual incorporation of the NR2C subunit that modifies Mg(2+) sensitivity and only later influences EPSC kinetics.


Figures

Fig. 1.
Fig. 1.
Age-dependent changes in the amplitude of non-NMDAR and NMDAR EPSCs. A, A single control EPSC recorded at P12 (−80 mV) showing an initial non-NMDAR component followed by a NMDAR component (top panel). The NMDAR EPSC was abolished in the presence of 50 μm AP-5 and 50 μm 7-CK (bottom panel), leaving the non-NMDAR-component. B, Average traces of consecutive EPSCs at P40 displayed on a faster time scale, indicating a clear separation of the NMDAR and non-NMDAR components. The amplitude of the non-NMDAR EPSC was measured at its peak (open circle); the NMDAR EPSC was measured 10 msec after the peak from a 1 msec epoch (filled circle). Traces are averaged from at least 20 evoked EPSCs and normalized to the peak.C, Amplitudes of the non-NMDAR (top panel) and NMDAR component (bottom panel) for each age group (n = 7 at P7, n = 17 at P12, n = 28 at P21, and n = 16 at P40). D, Amplitude ratio of NMDAR versus non-NMDAR component of the different age groups. For each age group, the ratio is indicated for each recorded cell (open circle); the average from each age group is indicated by a closed square (error bars indicate SEM). Note that at P12, the NMDAR EPSC is prominent, sometimes exceeding that of the non-NMDAR component.
Fig. 2.
Fig. 2.
Age-dependent changes in decay kinetics of NMDAR EPSCs. A, Representative normalized averaged NMDAR EPSCs at P7, P21, and P40. In all cases, the decay was best fitted by a double exponential function. The fitted functions are superimposed (black line) with their τfast and τslow values indicated. B, Plot of weighted τ (τω) versus age. Note that values of τω at P7 and P40 are significantly different from those at P12 and P21. For each age group, individual cells are indicated by an open circle, and the average from each age group is indicated by a closed symbol (error bars indicate SEM).C, Relative amplitude (in percentage) of fast and slow components versus time constant of decay. For each age group the mean τfast and the mean τslow are plotted versus their relative contribution to the total NMDAR EPSC.
Fig. 3.
Fig. 3.
Ifenprodil block of the NMDAR EPSC decreases with age. A–C, Average evoked EPSCs before and during bath application of 10 μm ifenprodil at P7 (A), P12 (B), and P21 (C). Note that only the NMDAR EPSC was reduced by ifenprodil. D, Mean percentage inhibition of the NMDAR EPSC induced by ifenprodil in the different age groups. The percentage inhibition was estimated by comparing the amplitude of the NMDAR EPSC 10 msec after the non-NMDAR peak in control conditions and 2 min after the onset of drug application. The percentage inhibition decreased significantly with age from 55 ± 4% at P7 (n = 6; p < 0.05) to 38 ± 8% at P12 (n = 6; p < 0.05) and 18 ± 6% at P21 (n = 6;p > 0.05).
Fig. 4.
Fig. 4.
Effect of ifenprodil on single-channel currents in outside-out patches from granule cells of different ages.A, B, Recordings at P7 and P21 in response to 10 μm NMDA (and 10 μm glycine). The bottom trace of each pair illustrates channel openings from the same cell in the presence of 10 μmifenprodil. C, Plots of mean current integral of single-channel activity, in the absence and presence of ifenprodil. Each dot represents charge transfer during a 100 msec epoch (filled circles). At P7, ifenprodil markedly reduced charge transfer (open circles). At P21 charge transfer was largely unaffected by ifenprodil. D, Plot summarizing percentage inhibition of channel activity by ifenprodil in patches from granule cells of various ages. The percentage of inhibition decreased significantly with age, from 73 ± 4% at P7 (n = 6; p < 0.05), to 48 ± 10% at P12 (n = 7;p < 0.05), and 25 ± 14% at P21 (n = 6; p > 0.05).
Fig. 5.
Fig. 5.
Age-dependent change in sensitivity of the NMDAR EPSC to Mg2+. A, Evoked EPSCs at P12 (top panel) and P21 (bottom panel), recorded in control medium (no added Mg2+) and in the presence of Mg2+(0.03 and 0.1 mm), and in 0 Mg2+ plus AP-5 and 7-CK (holding potential, −80 mV). Average traces, obtained at different Mg2+ concentrations were normalized to the peak and superimposed to allow a direct comparison of the dose-dependent inhibition of NMDAR EPSCs induced by Mg2+. For clarity only two Mg2+concentrations are depicted at each age (0.03 mm, 0.1 mm). At the end of each experiment 50 μm AP-5 and 50 μm 7-CK were applied to abolish any residual NMDAR-component. The remaining EPSC (the non-NMDAR-component) was subtracted from the traces to allow a direct estimate of charge transfer carried by the NMDAR-component. B, Mg2+ inhibition curve for NMDAR EPSCs. The mean charge transfer was estimated for each Mg2+concentration: 0.01 mm (n = 6 at P12;n = 4 at P21), 0.03 mm(n = 5 at p12; n = 10 at P21), 0.1 mm (n = 5 at P12;n = 10 at P21; n = 4 at P40), 0.3 mm (n = 11 at P12,n = 11 at P21), and 2 mm(n = 6 at P12; n = 6 at P21). The NMDAR EPSC, expressed as a percentage of control, was plotted versus Mg2+ concentration. Both curves were best fitted by the Hill equation (black curve). The IC50 values derived from the fit were 28 ± 2 μm at P12 and 76 ± 8 μm at P21 (p < 0.05).

References

    1. Akazawa C, Shigemoto R, Bessho Y, Nakanishi S, Mizuno N. Differential expression of five N-methyl-d-aspartate receptor subunit mRNAs in the cerebellum of developing and adult rats. J Comp Neurol. 1994;347:150–160. - PubMed
    1. Ascher P, Nowak L. The role of divalent cations in the N-methyl-d-aspartate responses of mouse central neurones in culture. J Physiol (Lond) 1988;399:247–266. - PMC - PubMed
    1. Bardoni R, Magherini PC, MacDermott AB. NMDA EPSCs at glutamatergic synapses in the spinal cord dorsal horn of the postnatal rat. J Neurosci. 1998;18:6558–6567. - PMC - PubMed
    1. Carmignoto G, Vicini S. Activity-dependent decrease in NMDA receptor responses during development of the visual cortex. Science. 1992;258:1007–1011. - PubMed
    1. Chazot PL, Coleman SK, Cik M, Stephenson FA. Molecular characterisation of N-methyl-d-aspartate receptors expressed in mammalian cells yields evidence for the coexistence of three subunit types within a discrete receptor molecule. J Biol Chem. 1994;269:24403–24409. - PubMed

Publication types

MeSH terms

LinkOut - more resources