. 2000 Aug 15;20(16):6181-92.
doi: 10.1523/JNEUROSCI.20-16-06181.2000.

Postsynaptic variability of firing in rat cortical neurons: the roles of input synchronization and synaptic NMDA receptor conductance

Affiliations

Postsynaptic variability of firing in rat cortical neurons: the roles of input synchronization and synaptic NMDA receptor conductance

A Harsch et al. J Neurosci. .

Abstract

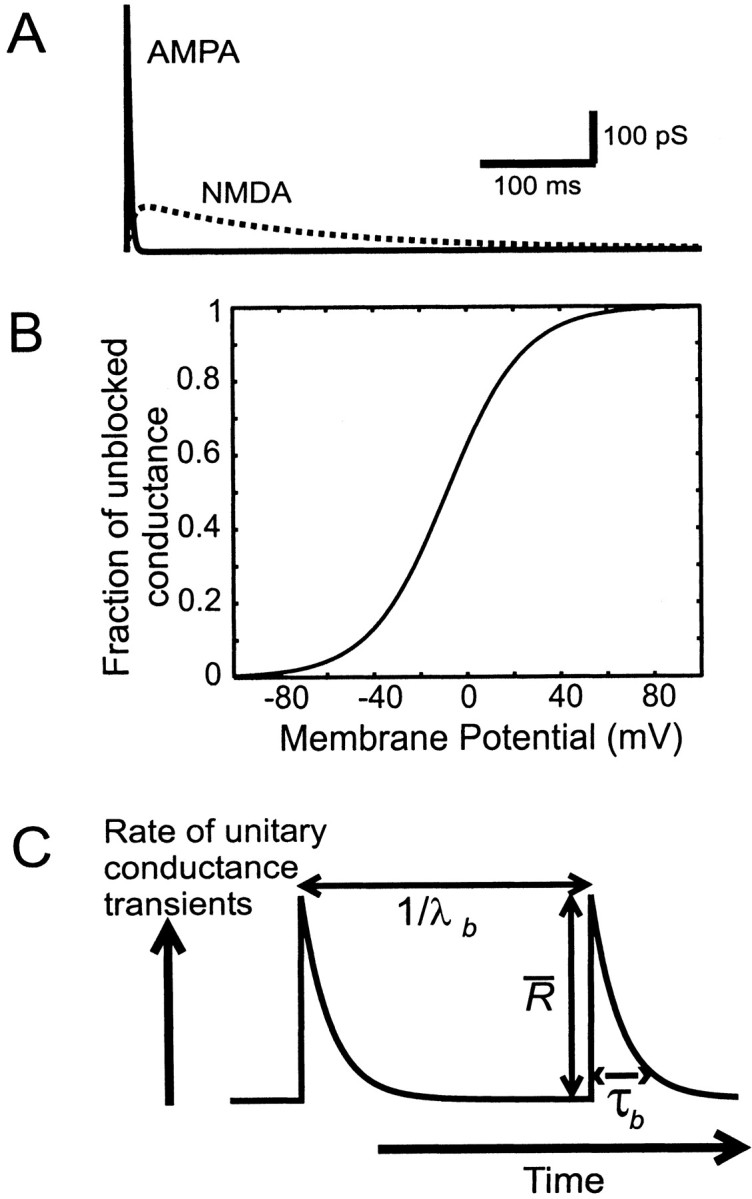
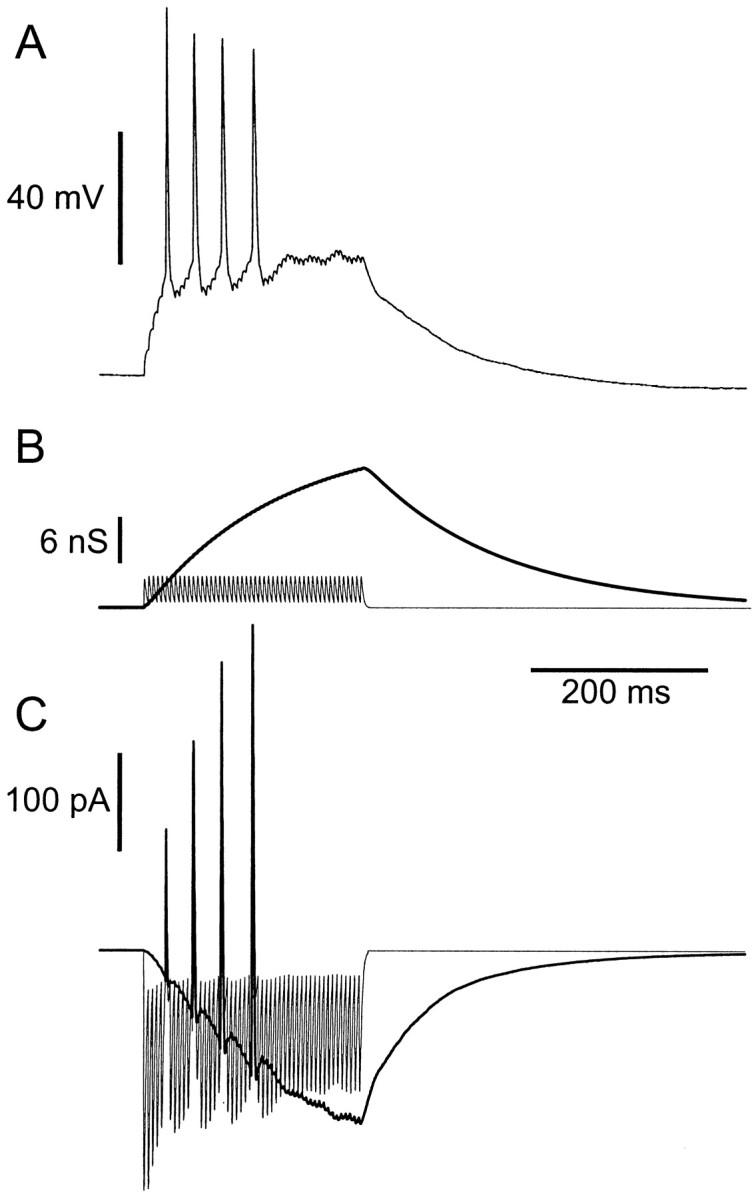
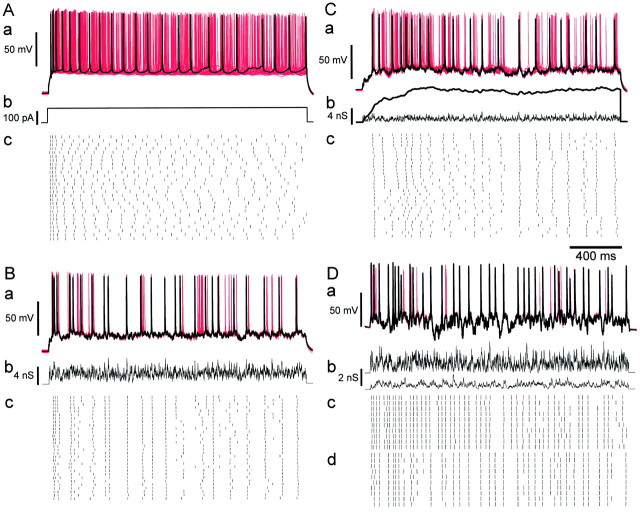
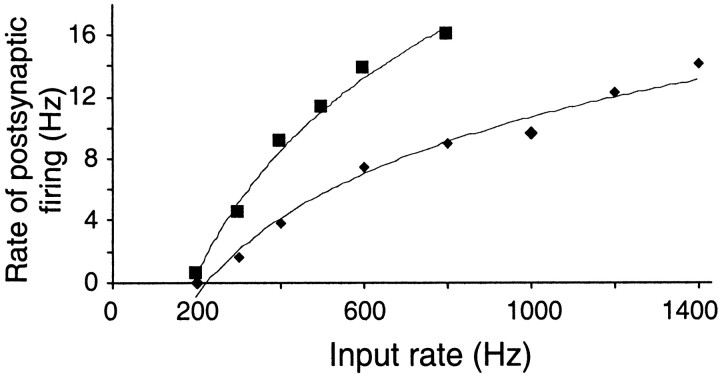
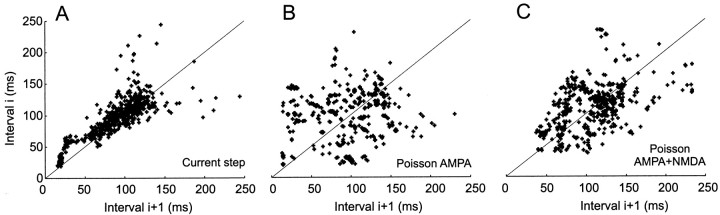
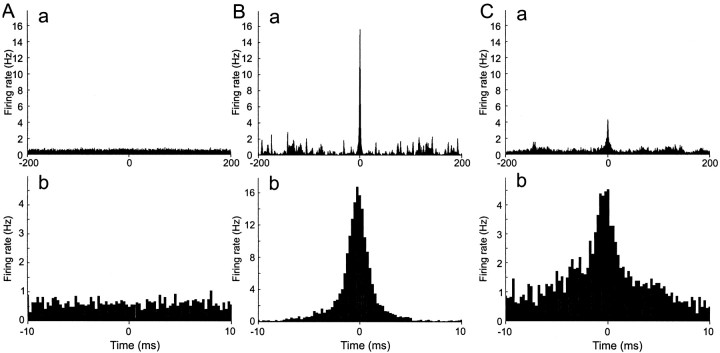
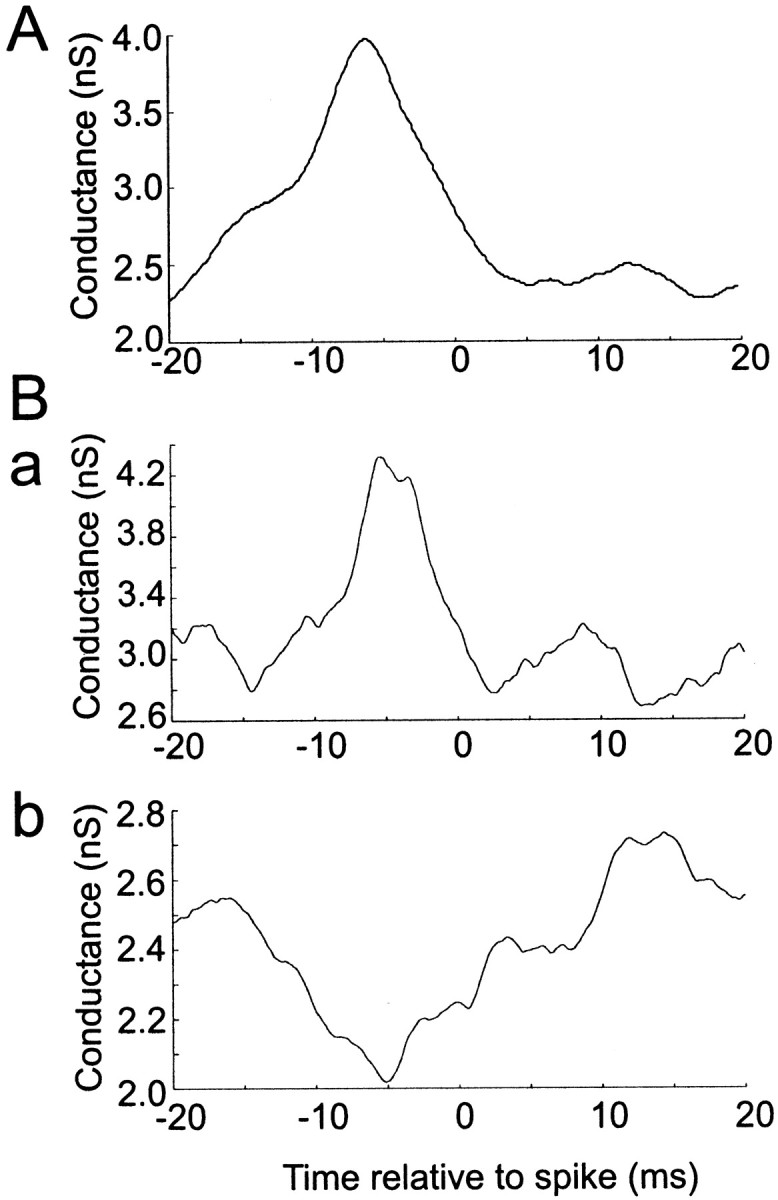
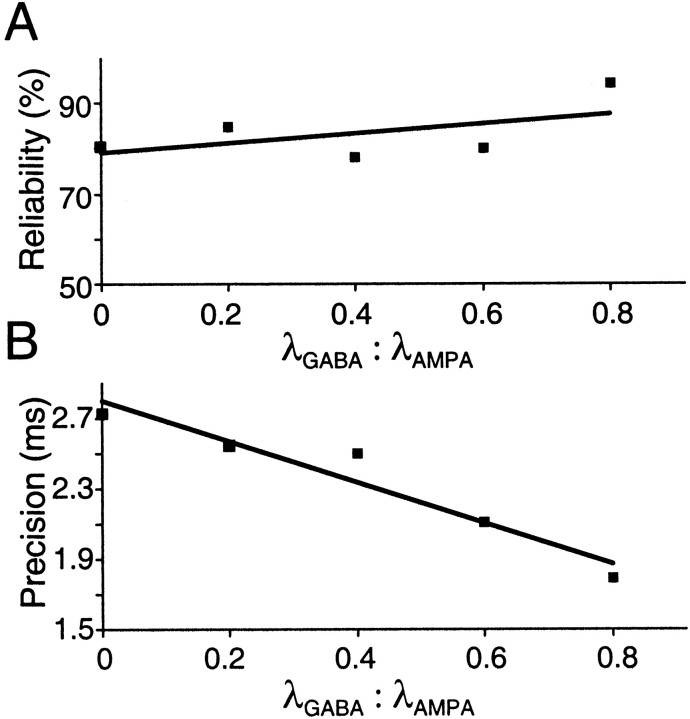
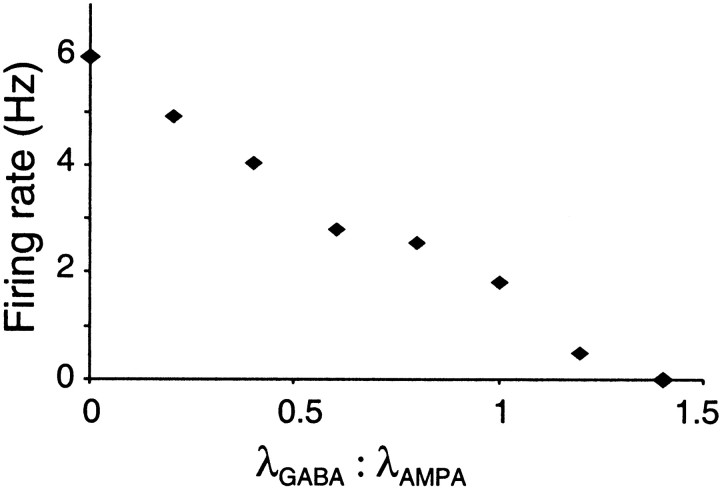
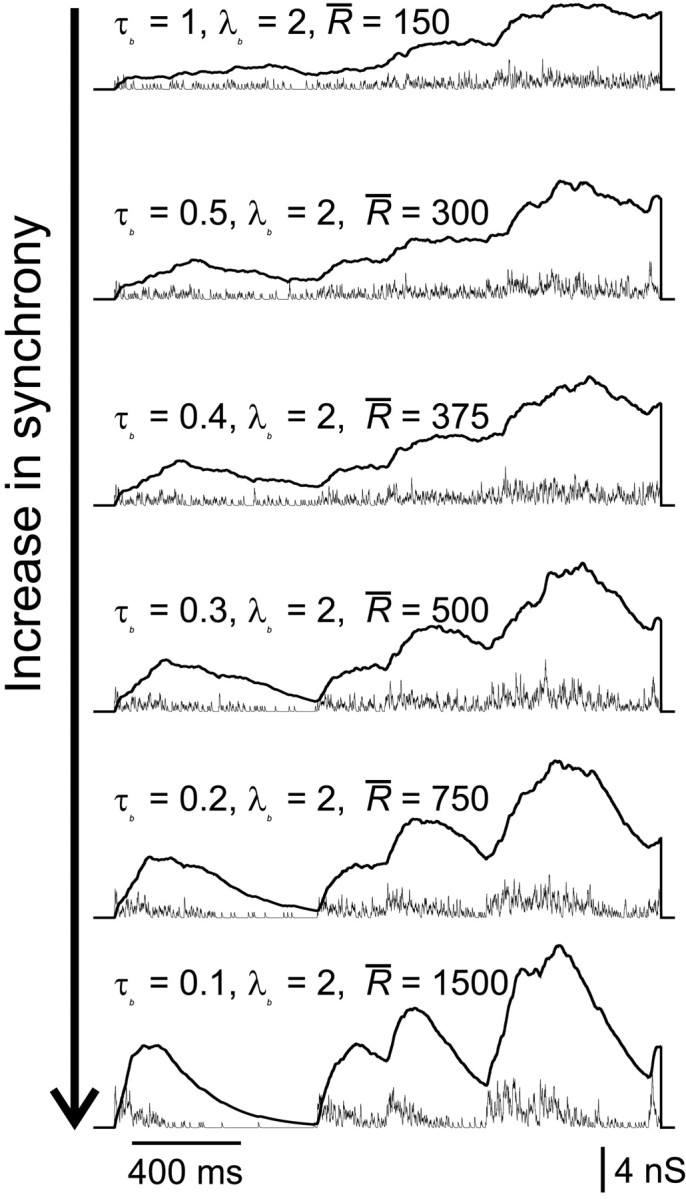
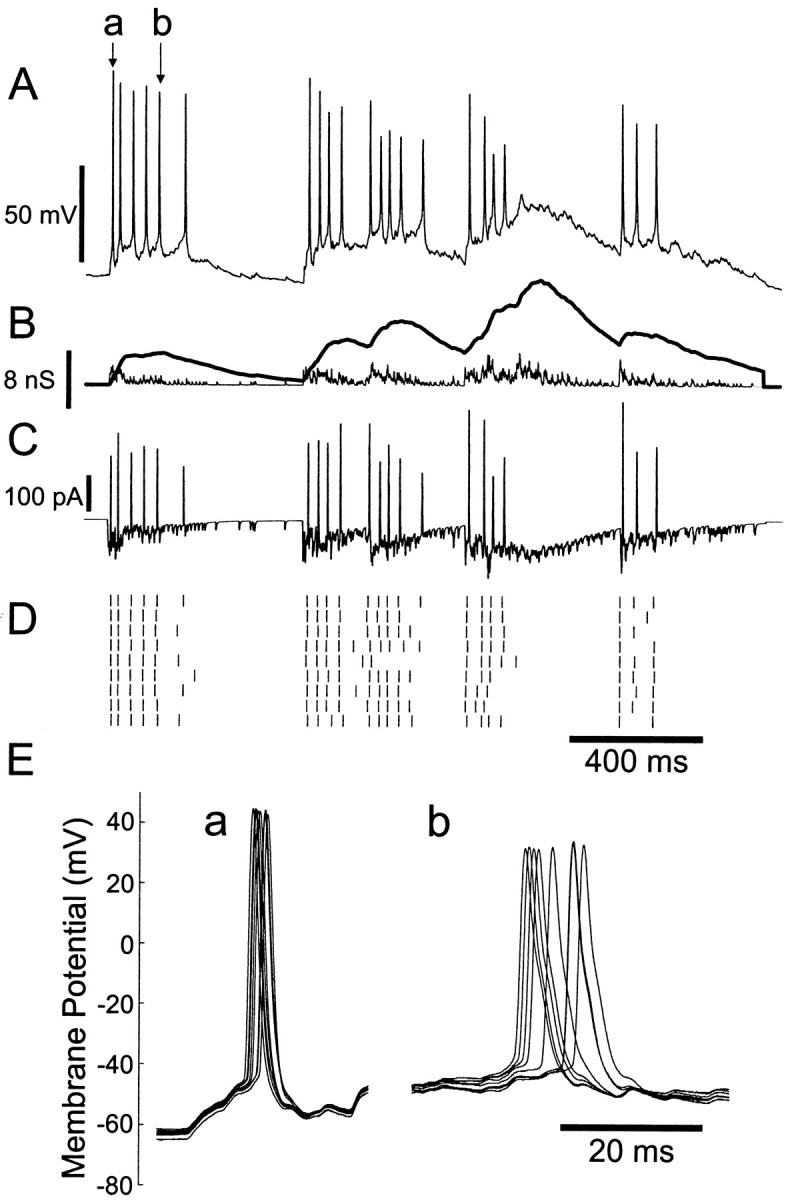
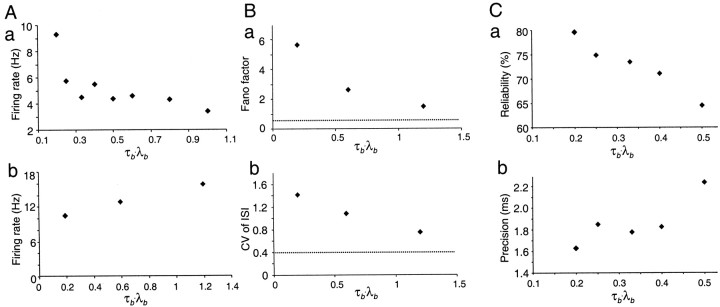
Neurons in the functioning cortex fire erratically, with highly variable intervals between spikes. How much irregularity comes from the process of postsynaptic integration and how much from fluctuations in synaptic input? We have addressed these questions by recording the firing of neurons in slices of rat visual cortex in which synaptic receptors are blocked pharmacologically, while injecting controlled trains of unitary conductance transients, to electrically mimic natural synaptic input. Stimulation with a Poisson train of fast excitatory (AMPA-type) conductance transients, to simulate independent inputs, produced much less variability than encountered in vivo. Addition of NMDA-type conductance to each unitary event regularized the firing but lowered the precision and reliability of spikes in repeated responses. Independent Poisson trains of GABA-type conductance transients (reversing at the resting potential), which simulated independent activity in a population of presynaptic inhibitory neurons, failed to increase timing variability substantially but increased the precision of responses. However, introduction of synchrony, or correlations, in the excitatory input, according to a nonstationary Poisson model, dramatically raised timing variability to in vivo levels. The NMDA phase of compound AMPA-NMDA events conferred a time-dependent postsynaptic variability, whereby the reliability and precision of spikes degraded rapidly over the 100 msec after the start of a synchronous input burst. We conclude that postsynaptic mechanisms add significant variability to cortical responses but that substantial synchrony of inputs is necessary to explain in vivo variability. We suggest that NMDA receptors help to implement a switch from precise firing to random firing during responses to concerted inputs.


Figures

Fig. 1.
Fig. 1.
Stimulus definition. A, The unitary excitatory conductance transient with a fast AMPA phase, injected according to Equation 1, and a much slower NMDA phase, injected with the voltage dependence described by Equation 2. B, The fraction of commanded NMDA conductance, which is unblocked, as a function of membrane potential F(V) = 1/[1 + K1exp (−K2V)] (see Eq. 2 and Materials and Methods). C, Diagrammatic representation of the model used to simulate concerted or synchronized inputs. See Materials and Methods for details.
Fig. 2.
Fig. 2.
Response to a periodic train of compound unitary conductance events. A, Membrane potential, showing an adapting response with four action potentials. B, Conductance stimulus, comprising a train of 50 unitary compound AMPA–NMDA events (see Fig. 1A) at 5 msec intervals. AMPA (thin lines) and NMDA (thick lines) components are shown separately. C, The total current command signal, produced according to Equation 1 for the AMPA component and Equation 2 for the NMDA component. Inward current is downward.
Fig. 3.
Fig. 3.
Responses of cortical neurons to conductance inputs. A, Constant current injection in a regular-spiking neuron. a, Superimposed membrane potential trajectories for ensemble of presentations of the same stimulus. Black tracecorresponds to top spike train in c; the remaining 29 traces are plotted in red. b, The stimulus, consisting of a 2 sec current step of 150 pA, applied at 30 sec intervals. c, Raster plot of spike times during 30 successive presentations of the stimulus. B, Responses to fluctuating Poisson AMPA conductance excitation. Same neuron as in A. a, Superimposed membrane potential trajectories, plotted as in A. b, The stimulus, constructed by summing a Poisson train (rate 1600 Hz) of unitary AMPA conductance transients. c, Raster plot of spike times in 30 successive trials. C, Responses to Poisson trains of compound AMPA–NMDA conductance transients. Same neuron as in A and B. a, Superimposed membrane potential trajectories, plotted as in A. b, The stimulus, constructed by summing a Poisson train (rate 800 Hz) of compound AMPA–NMDA transients. Thin trace indicates the AMPA component of the conductance command;thick trace indicates the activation of the NMDA conductance command. The injected level of NMDA conductance is a function of the membrane potential according to Equation 2 and is not shown. c, Raster plot of spike times in 30 successive trials. D, Effect of inhibition in a different regular-spiking neuron. a, Superimposed membrane potential trajectories, plotted as in A. b, Stimulus: AMPA-receptor mediated (top trace, 800 Hz) and GABA receptor-mediated (bottom trace, 300 Hz) conductances. c, Raster plot of spike times of the response to only the AMPA component of the stimulus (10 trials). d, Raster plot of the responses of the same neuron to both conductance components—the same ensemble as in a . Firing frequency is reduced by inhibition, and spikes are often increased in precision and delayed.
Fig. 4.
Fig. 4.
Input–output relationship of a regular-spiking pyramidal neuron. Average firing rate is plotted as a function of the rate of unitary AMPA conductance events (diamonds) or of compound AMPA–NMDA events (squares). Lines show fits to the equation Rout = k loge Rin − A, with k = 7.2 and A = 40 (AMPA); k = 11.7 and A = 61 (AMPA–NMDA).
Fig. 5.
Fig. 5.
Sequential interval maps of firing in interspike intervals. Interval i is plotted against interval i + 1 for (A) constant current step as in Figure3A, (B) Poisson AMPA train as in Figure 3B, and (C) Poisson AMPA–NMDA train as in Figure3C.
Fig. 6.
Fig. 6.
Cross-correlation functions. Same cell as in Figures 3A–C and 5. The average one-way cross-correlation of each trace with all other traces in an ensemble was computed, excluding the first 200 msec of each spike train. A, Constant current stimulation. B, Poisson AMPA train stimulation. Fluctuating pattern of conductance input AMPA receptor conductance transients. C, Poisson compound AMPA–NMDA stimulation.
Fig. 7.
Fig. 7.
Average fast conductance changes associated with spikes. A, Spike-triggered average of AMPA conductance during Poisson AMPA stimulation, λ = 1600 Hz. B, Combined Poisson AMPA (2000 Hz) and GABA (1200 Hz) stimulation. Spike-triggered average of (a) AMPA conductance and (b) GABA conductance.
Fig. 8.
Fig. 8.
Effect of inhibition on reliability and precision. Points are averages from 10 trials, in one regular-spiking neuron.
Fig. 9.
Fig. 9.
Decrease in firing rate with increasing rate of GABA transients. λAMPA = 1000 Hz.
Fig. 10.
Fig. 10.
Examples of synchronous stimuli. Changing τb relative to λb (see Materials and Methods) smoothly increases the synchrony of unitary compound events (thin traces: AMPA; thick traces: NMDA). For clarity of presentation, the same burst times are used to compute each stimulus in this figure; in experiments, these were varied randomly in different stimuli.
Fig. 11.
Fig. 11.
Responses to synchronous bursts of compound AMPA–NMDA conductance events, in a regular-spiking neuron. A, An example of membrane potential response (corresponding to top spike train in D). B, Conductance stimulus. Synchronized clusters of events were generated with parameters (see Materials and Methods) R¯ = 1200 Hz, τb = 0.1 sec, and λb = 2.5 sec−1. Thin line: AMPA conductance;thick line: NMDA conductance. C, Total command current resulting from interaction of conductance input and membrane potential trajectory. D, Raster plot. E, Superimposed membrane potential trajectories for precise spike a and imprecise spike b (as indicated in A).
Fig. 12.
Fig. 12.
Effect of synchrony on firing rate, spike variability, reliability, and precision. In all experiments shown, synchrony was increased by reducing the value of τb for a fixed value of λb (2 Hz), and scaling up R¯ correspondingly to maintain the same mean rate of compound AMPA–NMDA excitatory conductance transients (300 Hz). A, Effect of synchrony on mean firing rate. a, In a fast-adapting neuron, firing rate increases with increasing synchrony. b, In a regular spiking neuron, the firing rate decreases with increasing synchrony. B, Effect of synchrony on spike timing variability in a regular-spiking neuron. Both Fano factor and CV of interspike intervals are increased by synchronous stimuli, to much higher values than for uncorrelated Poisson stimulus trains (indicated by dotted lines) and to values within the range of those commonly observed in vivo. Results are from 30 trials with resynthesized timings of unitary events in one cell. C, Increasing synchrony increases reliability (a) and reduces spike time jitter (b) in a regular-spiking cell (10 trials).
Fig. 13.
Fig. 13.
Loss of precision with time in response to synchronous bursts. A, Ensemble spike response to a synchronous stimulus (τb = 0.2, λb = 1, R¯ = 800 Hz) of compound AMPA (thin line) and NMDA (thick line) conductances. B, Response of the same neuron to an AMPA-only conductance stimulus, in which R¯ is increased to 2000 Hz to give the same duration of response. C, The jitter of identified spikes increases with time after onset of burst. With NMDA conductance (•), the rate of this increase is approximately three times faster than without (○).

References

    1. Abeles M. Corticonics: neural circuits of the cerebral cortex. Cambridge UP; Cambridge, UK: 1991.
    1. Aihara K, Matsumoto G. Chaos (Holden AV, ed. Manchester UP; Manchester, UK: 1986. Chaotic oscillations and bifurcations in squid giant axons. pp. 257–269.
    1. Arieli A, Sterkin A, Grinvald A, Aertsen A. Dynamics of ongoing activity: explanation of the large variability in evoked-cortical responses. Science. 1996;273:1868–1871. - PubMed
    1. Ascher P, Nowak L. The role of divalent cations in the N -methyl-d-aspartate responses of mouse central neurons in culture. J Physiol (Lond) 1988;399:247–266. - PMC - PubMed
    1. Azouz R, Gray CM. Cellular mechanisms contributing to response variability of cortical neurons in vivo. J Neurosci. 1999;19:2209–2223. - PMC - PubMed

Publication types

Substances

LinkOut - more resources