

K-Ras-independent effects of the farnesyl transferase inhibitor L-744,832 on cyclin B1/Cdc2 kinase activity, G2/M cell cycle progression and apoptosis in human pancreatic ductal adenocarcinoma cells
- PMID: 10935512
- PMCID: PMC1507570
- DOI: 10.1038/sj.neo.7900088
K-Ras-independent effects of the farnesyl transferase inhibitor L-744,832 on cyclin B1/Cdc2 kinase activity, G2/M cell cycle progression and apoptosis in human pancreatic ductal adenocarcinoma cells
Abstract
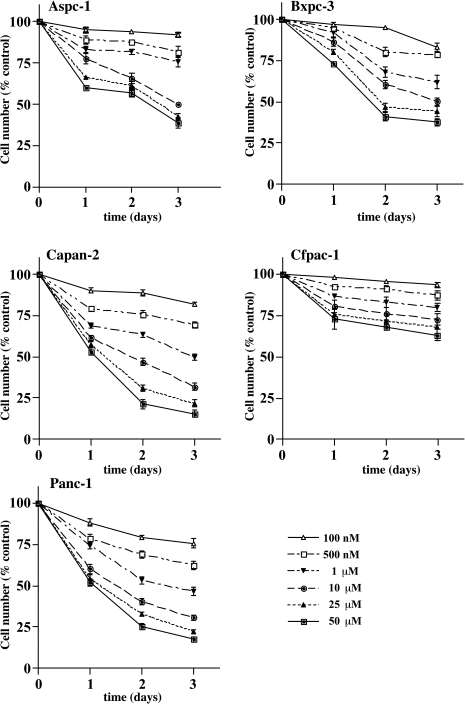
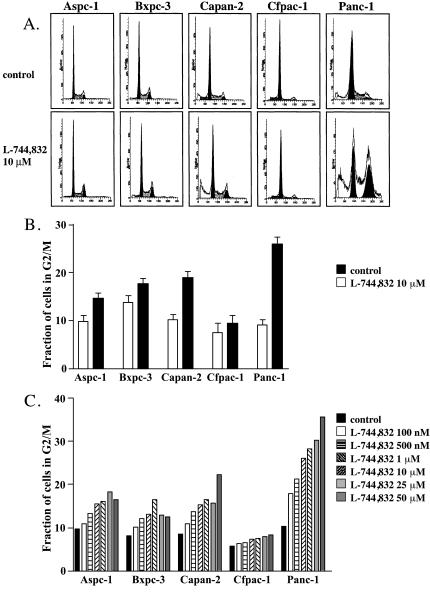
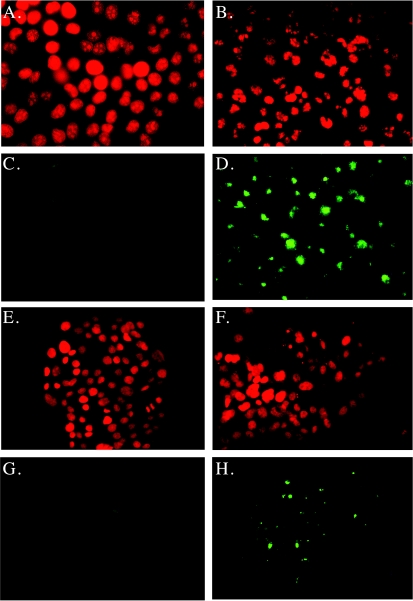
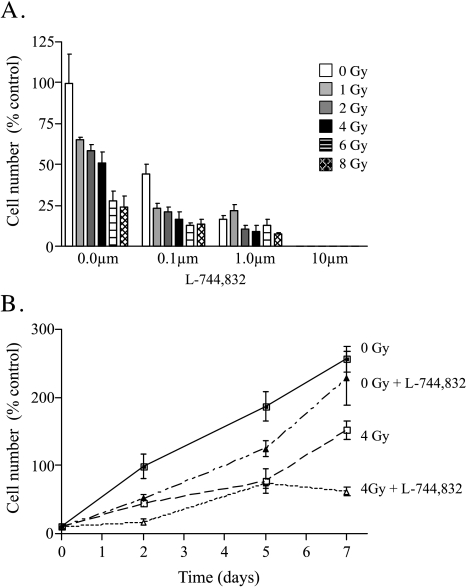
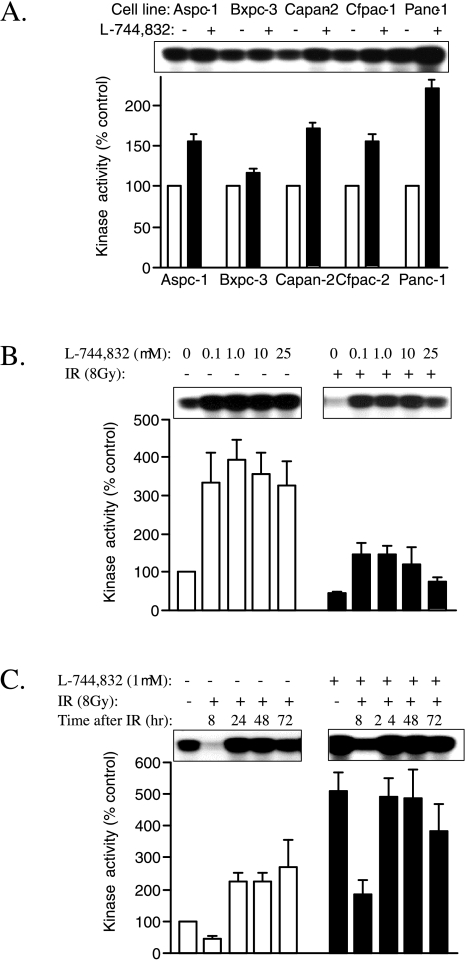
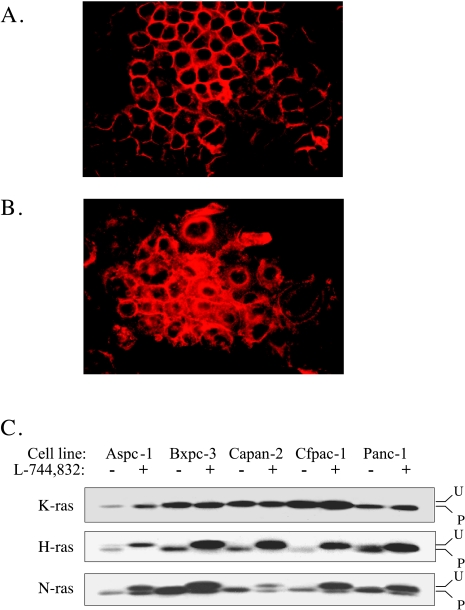
Pancreatic ductal adenocarcinoma is a highly lethal malignancy that is resistant to traditional cytotoxic therapy. High rates of activating codon 12 K-Ras mutations in this disease have generated considerable interest in the therapeutic application of novel farnesyl transferase inhibitors (FTIs). However, a comprehensive analysis of the effects of FTI treatment on pancreatic cancer cells has not been performed. Treatment of five different human pancreatic cancer cell lines with FTI L-744,832 resulted in inhibition of anchorage-dependent growth, with wide variation in sensitivity among different lines. Effective growth inhibition by L-744,832 correlated with accumulation of cells with a tetraploid (4N) DNA content and high levels of cyclin B1/cdc2 kinase activity, implying cell cycle arrest downstream from the DNA damage-inducible G2/M cell cycle checkpoint. In addition, sensitive cell lines underwent apoptosis as evidenced by changes in nuclear morphology and internucleosomal DNA fragmentation. L-744,832 at a concentration of 1 microM additively enhanced the cytotoxic effect of ionizing radiation, apparently by overriding G2/M checkpoint activation. The effects of FTI treatment on cell growth and cell cycle regulation were associated with changes in posttranslational processing of H-Ras and N-Ras, but not K-Ras. The results confirm the potential therapeutic efficacy of FTI treatment in pancreatic cancer, and suggest that farnesylated proteins other than K-Ras may act as important regulators of G2/M cell cycle kinetics.
Figures
Similar articles
-
Farnesyltransferase inhibitor (L-744,832) restores TGF-beta type II receptor expression and enhances radiation sensitivity in K-ras mutant pancreatic cancer cell line MIA PaCa-2.Oncogene. 2002 Nov 7;21(51):7883-90. doi: 10.1038/sj.onc.1205948. Oncogene. 2002. PMID: 12420225
-
Growth inhibition of astrocytoma cells by farnesyl transferase inhibitors is mediated by a combination of anti-proliferative, pro-apoptotic and anti-angiogenic effects.Oncogene. 1999 Dec 9;18(52):7514-26. doi: 10.1038/sj.onc.1203105. Oncogene. 1999. PMID: 10602510
-
A farnesyl-protein transferase inhibitor induces p21 expression and G1 block in p53 wild type tumor cells.J Biol Chem. 1998 Aug 7;273(32):20243-51. doi: 10.1074/jbc.273.32.20243. J Biol Chem. 1998. PMID: 9685373
-
Regulation of the G2/M transition by p53.Oncogene. 2001 Apr 5;20(15):1803-15. doi: 10.1038/sj.onc.1204252. Oncogene. 2001. PMID: 11313928 Review.
-
Cyclin Dependent Kinase-1 (CDK-1) Inhibition as a Novel Therapeutic Strategy against Pancreatic Ductal Adenocarcinoma (PDAC).Cancers (Basel). 2021 Aug 30;13(17):4389. doi: 10.3390/cancers13174389. Cancers (Basel). 2021. PMID: 34503199 Free PMC article. Review.
Cited by
-
[6]-Gingerol induces cell cycle arrest and cell death of mutant p53-expressing pancreatic cancer cells.Yonsei Med J. 2006 Oct 31;47(5):688-97. doi: 10.3349/ymj.2006.47.5.688. Yonsei Med J. 2006. PMID: 17066513 Free PMC article.
-
From basic researches to new achievements in therapeutic strategies of KRAS-driven cancers.Cancer Biol Med. 2019 Aug;16(3):435-461. doi: 10.20892/j.issn.2095-3941.2018.0530. Cancer Biol Med. 2019. PMID: 31565476 Free PMC article.
-
Mitosis as an anti-cancer drug target.Chromosoma. 2013 Oct;122(5):431-49. doi: 10.1007/s00412-013-0419-8. Epub 2013 Jun 18. Chromosoma. 2013. PMID: 23775312 Review.
-
The farnesyl transferase inhibitor RPR-130401 does not alter radiation susceptibility in human tumor cells with a K-Ras mutation in spite of large changes in ploidy and lamin B distribution.BMC Pharmacol. 2002;2:2. doi: 10.1186/1471-2210-2-2. Epub 2002 Feb 6. BMC Pharmacol. 2002. PMID: 11929613 Free PMC article.
-
The epidermal growth factor receptor inhibitor gefitinib prevents the progression of pancreatic lesions to carcinoma in a conditional LSL-KrasG12D/+ transgenic mouse model.Cancer Prev Res (Phila). 2010 Nov;3(11):1417-26. doi: 10.1158/1940-6207.CAPR-10-0038. Cancer Prev Res (Phila). 2010. PMID: 21084261 Free PMC article.
References
-
- Zhang FL, Casey PJ. Protein prenylation: molecular mechanisms and functional consequences. Annu Rev Biochem. 1996;65:241–269. - PubMed
-
- Gibbs JB, Oliff A. The potential of farnesyltransferase inhibitors as cancer chemotherapeutics. Annu Rev Pharmacol Toxicol. 1997;37:143–166. - PubMed
-
- Armstrong SA, Hannah VC, Goldstein JL, Brown MS. CAAX geranylgeranyl transferase transfers farnesyl as effeciently as geranylgeranyl to RhoB. J Biol Chem. 1995;270:7864–7868. - PubMed
-
- James GL, Goldstein JL, Brown MS. Polylysine and CVIM sequences of K-RasB dictate specificity of prenylation and confer resistance to benzodiazepine peptidomimetic in vitro. J Biol Chem. 1995;270:6221–6226. - PubMed
-
- Andres AD, Seabra MC, Brown MS, Armstrong SA, Smeland TE, Cremers FPM, Goldstein JL. cDNA cloning of component A of Rab geranylgeranyltransferase and demonstration of its role as a Rab escort protein. Cell. 1993;73:1091–1099. - PubMed
Publication types
MeSH terms
Substances
Grants and funding
LinkOut - more resources
Full Text Sources
Other Literature Sources
Medical
Research Materials
Miscellaneous