Imaging prostate cancer invasion with multi-nuclear magnetic resonance methods: the Metabolic Boyden Chamber
- PMID: 10935513
- PMCID: PMC1507569
- DOI: 10.1038/sj.neo.7900089
Imaging prostate cancer invasion with multi-nuclear magnetic resonance methods: the Metabolic Boyden Chamber
Abstract
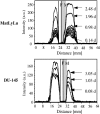
The physiological milieu within solid tumors can influence invasion and metastasis. To determine the impact of the physiological environment and cellular metabolism on cancer cell invasion, it is necessary to measure invasion during well-controlled modulation of the physiological environment. Recently, we demonstrated that magnetic resonance imaging can be used to monitor cancer cell invasion into a Matrigel layer [Artemov D, Pilatus U, Chou S, Mori N, Nelson JB, and Bhujwalla ZM (1999). Dynamics of prostate cancer cell invasion studied in vitro by NMR microscopy. Mag Res Med 42, 277-282.]. Here we have developed an invasion assay ("Metabolic Boyden Chamber") that combines this capability with the properties of our isolated cell perfusion system. Long-term experiments can be performed to determine invasion as well as cellular metabolism under controlled environmental conditions. To characterize the assay, we performed experiments with prostate cancer cell lines preselected for different invasive characteristics. The results showed invasion into, and degradation of the Matrigel layer, by the highly invasive/metastatic line (MatLyLu), whereas no significant changes were observed for the less invasive/metastatic cell line (DU-145). With this assay, invasion and metabolism was measured dynamically, together with oxygen tensions within the cellular environment and within the Matrigel layer. Such a system can be used to identify physiological and metabolic characteristics that promote invasion, and evaluate therapeutic interventions to inhibit invasion.
Figures


Similar articles
-
Dynamics of prostate cancer cell invasion studied in vitro by NMR microscopy.Magn Reson Med. 1999 Aug;42(2):277-82. doi: 10.1002/(sici)1522-2594(199908)42:2<277::aid-mrm9>3.0.co;2-9. Magn Reson Med. 1999. PMID: 10440952
-
Inhibitors of prostaglandin synthesis inhibit human prostate tumor cell invasiveness and reduce the release of matrix metalloproteinases.Cancer Res. 2000 Aug 15;60(16):4629-37. Cancer Res. 2000. PMID: 10969817
-
Lymphatic endothelial cells actively regulate prostate cancer cell invasion.NMR Biomed. 2016 Jul;29(7):904-11. doi: 10.1002/nbm.3543. Epub 2016 May 5. NMR Biomed. 2016. PMID: 27149683
-
Spherical Invasion Assay: A Novel Method to Measure Invasion of Cancer Cells.Bio Protoc. 2022 Feb 20;12(4):e4320. doi: 10.21769/BioProtoc.4320. eCollection 2022 Feb 20. Bio Protoc. 2022. PMID: 35340295 Free PMC article.
-
The physiological environment in cancer vascularization, invasion and metastasis.Novartis Found Symp. 2001;240:23-38; discussion 38-45, 152-3. doi: 10.1002/0470868716.ch3. Novartis Found Symp. 2001. PMID: 11727932 Review.
Cited by
-
Molecular imaging of metastatic potential.J Nucl Med. 2008 Jun;49 Suppl 2(Suppl 2):96S-112S. doi: 10.2967/jnumed.107.045948. J Nucl Med. 2008. PMID: 18523068 Free PMC article. Review.
-
Androgen receptor is a tumor suppressor and proliferator in prostate cancer.Proc Natl Acad Sci U S A. 2008 Aug 26;105(34):12182-7. doi: 10.1073/pnas.0804700105. Epub 2008 Aug 22. Proc Natl Acad Sci U S A. 2008. PMID: 18723679 Free PMC article.
-
MRI of metastasis-permissive microenvironments.Future Oncol. 2011 Nov;7(11):1269-84. doi: 10.2217/fon.11.114. Future Oncol. 2011. PMID: 22044202 Free PMC article. Review.
-
Prostate fibroblasts and prostate cancer associated fibroblasts exhibit different metabolic, matrix degradation and PD-L1 expression responses to hypoxia.Front Mol Biosci. 2024 Mar 22;11:1354076. doi: 10.3389/fmolb.2024.1354076. eCollection 2024. Front Mol Biosci. 2024. PMID: 38584702 Free PMC article.
-
MRI of mouse models for gliomas shows similarities to humans and can be used to identify mice for preclinical trials.Neoplasia. 2002 Nov-Dec;4(6):480-5. doi: 10.1038/sj.neo.7900269. Neoplasia. 2002. PMID: 12407441 Free PMC article.
References
-
- Artemov D, Pilatus U, Chou S, Mori N, Nelson JB, Bhujwalla ZM. Dynamics of prostate cancer cell invasion studied in vitro by NMR microscopy. Magn Reson Med. 1999;42:277–282. - PubMed
-
- Nicolson GL. Generation of phenotypic diversity and progression in metastatic tumor cells. Cancer Metastasis Rev. 1984;3:25–42. - PubMed
-
- Dairkee SH, Deng G, Stampfer MR, Waldman FM, Smith HS. Selective cell culture of primary breast carcinoma. Cancer Res. 1995;55:2516–2519. - PubMed
-
- Azzopardi JG. Problems in Breast Pathology. Philadelphia: W.B. Saunders; 1979. - PubMed
-
- Kato Y, Nakayama Y, Umeda M, Miyazaka K. Induction of 103 kDa gelatinase/type IV collagenase by acidic culture conditions in mouse metastatic melanoma cell lines. J Biol Chem. 1992;267:11424–11430. - PubMed
Publication types
MeSH terms
Grants and funding
LinkOut - more resources
Full Text Sources
Medical
Research Materials
