

Farnesol-induced cell death and stimulation of 3-hydroxy-3-methylglutaryl-coenzyme A reductase activity in tobacco cv bright yellow-2 cells
- PMID: 10938345
- PMCID: PMC59085
- DOI: 10.1104/pp.123.4.1257
Farnesol-induced cell death and stimulation of 3-hydroxy-3-methylglutaryl-coenzyme A reductase activity in tobacco cv bright yellow-2 cells
Abstract
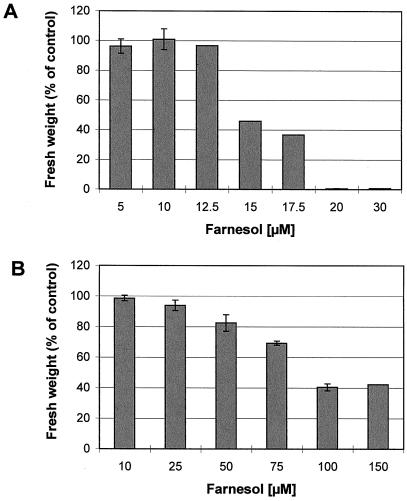
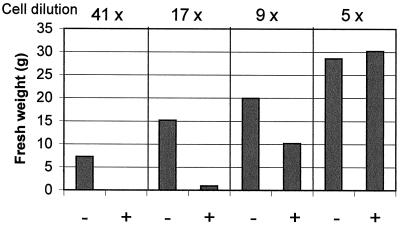
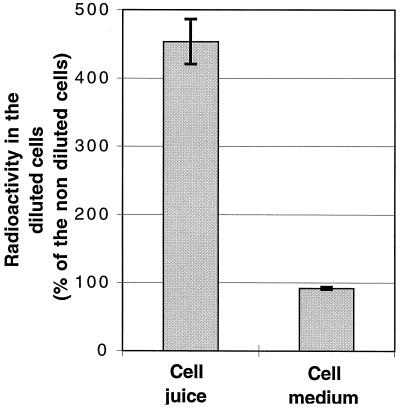
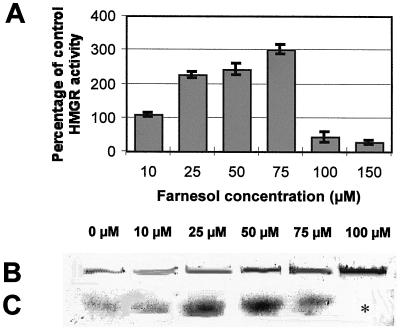
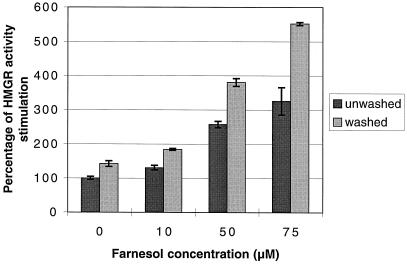
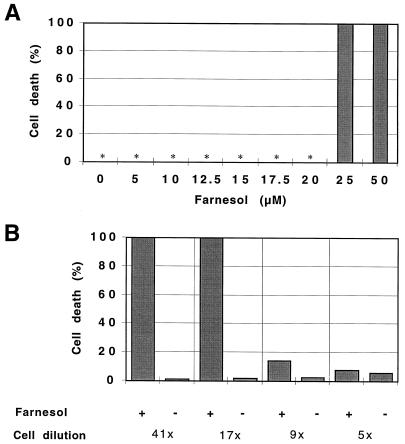
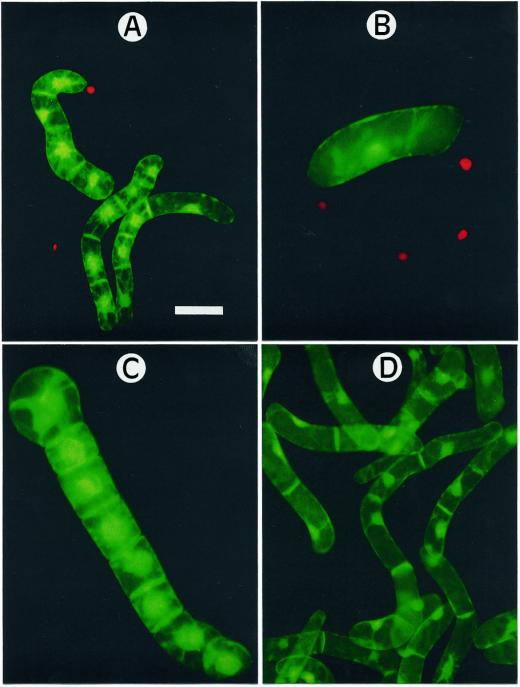
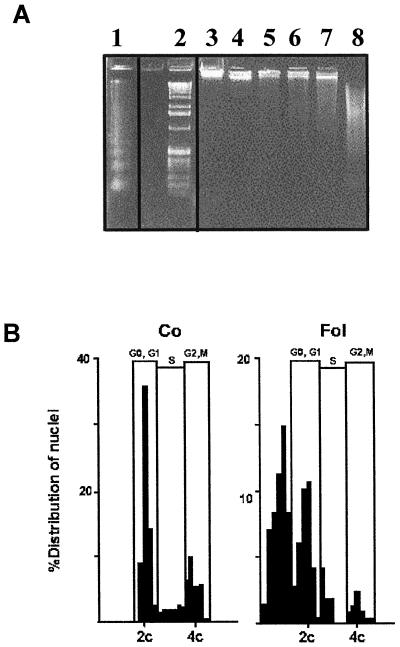
Growth inhibition of tobacco (Nicotiana tabacum L. cv Bright Yellow-2) cells by mevinolin, a specific inhibitor of 3-hydroxy-3-methylglutaryl-coenzyme A reductase (HMGR) could be partially overcome by the addition of farnesol. However, farnesol alone inhibited cell division and growth as measured by determination of fresh weight increase. When 7-d-old tobacco cv Bright Yellow-2 cells were diluted 40-fold into fresh culture, the cells exhibited a dose-dependent sensitivity to farnesol, with 25 microM sufficient to cause 100% cell death, as measured by different staining techniques, cytometry, and monitoring of fragmentation of genomic DNA. Cells were less sensitive to the effects of farnesol when diluted only 4-fold. Farnesol was absorbed by the cells, as examined by [1-(3)H]farnesol uptake, with a greater relative enrichment by the more diluted cells. Both mevinolin and farnesol treatments stimulated apparent HMGR activity. The stimulation by farnesol was also reflected in corresponding changes in the steady-state levels of HMGR mRNA and enzyme protein with respect to HMGR gene expression and enzyme protein accumulation.
Figures
Similar articles
-
Cross-talk between the cytosolic mevalonate and the plastidial methylerythritol phosphate pathways in tobacco bright yellow-2 cells.J Biol Chem. 2003 Jul 18;278(29):26666-76. doi: 10.1074/jbc.M302526200. Epub 2003 May 7. J Biol Chem. 2003. PMID: 12736259
-
Farnesol is not the nonsterol regulator mediating degradation of HMG-CoA reductase in rat liver.Arch Biochem Biophys. 1996 Apr 15;328(2):324-30. doi: 10.1006/abbi.1996.0180. Arch Biochem Biophys. 1996. PMID: 8645011
-
Inhibition of squalene synthase and squalene epoxidase in tobacco cells triggers an up-regulation of 3-hydroxy-3-methylglutaryl coenzyme a reductase.Plant Physiol. 2002 Sep;130(1):334-46. doi: 10.1104/pp.004655. Plant Physiol. 2002. PMID: 12226513 Free PMC article.
-
Structural mechanism for statin inhibition of 3-hydroxy-3-methylglutaryl coenzyme A reductase.Am Heart J. 2002 Dec;144(6 Suppl):S27-32. doi: 10.1067/mhj.2002.130300. Am Heart J. 2002. PMID: 12486413 Review.
-
Molecular mechanisms involved in farnesol-induced apoptosis.Cancer Lett. 2010 Jan 28;287(2):123-35. doi: 10.1016/j.canlet.2009.05.015. Epub 2009 Jun 10. Cancer Lett. 2010. PMID: 19520495 Free PMC article. Review.
Cited by
-
Miltiradiene Production by Cytoplasmic Metabolic Engineering in Nicotiana benthamiana.Metabolites. 2023 Dec 6;13(12):1188. doi: 10.3390/metabo13121188. Metabolites. 2023. PMID: 38132870 Free PMC article.
-
Transgenic tobacco overexpressing Brassica juncea HMG-CoA synthase 1 shows increased plant growth, pod size and seed yield.PLoS One. 2014 May 21;9(5):e98264. doi: 10.1371/journal.pone.0098264. eCollection 2014. PLoS One. 2014. PMID: 24847714 Free PMC article.
-
Unravelling the Puzzle of Anthranoid Metabolism in Living Plant Cells Using Spectral Imaging Coupled to Mass Spectrometry.Metabolites. 2021 Aug 25;11(9):571. doi: 10.3390/metabo11090571. Metabolites. 2021. PMID: 34564386 Free PMC article.
-
A review of tobacco BY-2 cells as an excellent system to study the synthesis and function of sterols and other isoprenoids.Lipids. 2004 Aug;39(8):723-35. doi: 10.1007/s11745-004-1289-0. Lipids. 2004. PMID: 15638240 Review.
-
Identification, functional characterization, and regulation of the enzyme responsible for floral (E)-nerolidol biosynthesis in kiwifruit (Actinidia chinensis).J Exp Bot. 2012 Mar;63(5):1951-67. doi: 10.1093/jxb/err393. Epub 2011 Dec 7. J Exp Bot. 2012. PMID: 22162874 Free PMC article.
References
-
- Adany I, Yazlovitskaya EM, Haug JS, Voziyan PA, Melnykovych G. Differences in sensitivity to farnesol toxicity between neoplastically- and non-neoplastically-derived cells in culture. Cancer Lett. 1994;79:175–179. - PubMed
-
- Bach TJ. Synthesis and metabolism of mevalonic acid in plants. Plant Physiol Biochem. 1987;25:163–178.
-
- Bach TJ. Some new aspects of isoprenoid biosynthesis in plants—a review. Lipids. 1995;30:191–202. - PubMed
-
- Bach TJ, Lichtenthaler HK. Inhibition by mevinolin of plant growth, sterol formation and pigment accumulation. Physiol Plant. 1983;59:50–60.
-
- Bach TJ, Lichtenthaler HK. Plant growth regulation by mevinolin and other sterol biosynthesis inhibitors. In: Fuller G, Nes WD, editors. Ecology and Metabolism of Plant Lipids. American Chemical Society Symposium Series. Vol. 325. Washington, DC: American Chemical Society; 1987. pp. 109–139.
Publication types
MeSH terms
Substances
LinkOut - more resources
Full Text Sources
