Comparative Study
. 2000 Aug 15;527 Pt 1(Pt 1):11-31.
doi: 10.1111/j.1469-7793.2000.t01-1-00011.x.

Single-channel properties of neuronal GABAA receptors from mice lacking the 2 subunit

Affiliations
Comparative Study

Single-channel properties of neuronal GABAA receptors from mice lacking the 2 subunit

M Lorez et al. J Physiol. .

Abstract

1. The aim of this study was to define the biophysical properties contributed by the gamma2 subunit to native single GABAA receptors. 2. Single-channel activity was recorded from neurones of wild-type (gamma2+/+) mice and compared with that from mice which were heterozygous (gamma2+/-) or homozygous (gamma2-/-) for a targeted disruption in the gamma2 subunit gene of the GABAA receptor. Unitary currents were evoked by low concentrations of GABA (0.5-5 microM) in membrane patches from acutely isolated dorsal root ganglion (DRG) neurones (postnatal day 0) and by 1 microM GABA in patches from embryonic hippocampal neurones which were cultured for up to 3 weeks. 3. GABAA receptors from DRG and hippocampal neurones of gamma2+/+ and gamma2+/- mice displayed predominantly a conductance state of 28 pS and less frequently 18 and 12 pS states. In gamma2-/- mice, conductance states mainly of 12 pS and less frequently of 24 pS were found. 4. The mean open duration of the 28 pS state in gamma2+/+ GABAA receptors (1.5-2.6 ms) was substantially longer than for the 12 pS state of gamma2-/- GABAA receptors (0.9-1.2 ms) at all GABA concentrations. For gamma2+/+ and gamma2-/- channels, the mean open duration was increased at higher GABA concentrations. 5. Open duration frequency distributions of 28 and 12 pS receptors revealed the existence of at least three exponential components. Components with short mean durations declined and components with long mean durations increased in relative frequency at higher GABA concentration indicating at least two binding sites of GABA per 28 and 12 pS receptor. 6. Shut time frequency distributions revealed at least four exponential components of which two were identified as intraburst components in 28 pS and one in 12 pS GABAA receptors. 7. The mean burst duration and the mean number of openings per burst increased in 28 and 12 pS GABAA receptors with increasing GABA concentration. At least two burst types were identified: simple bursts consisting of single openings and complex bursts of five to six openings in 28 pS but only two to three openings in 12 pS GABAA receptors. 8. We conclude that the gamma2 subunit enhances the efficacy of GABA by determining open conformations of high conductance and long lifetime, and by prolonging the time receptors remain in the activated bursting state.


Figures
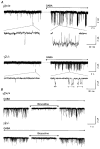
Figure 1
Figure 1. GABA-gated openings in outside-out patches from γ2+/+ and γ2−/− neurones
A, main conductance single-channel openings (downward current steps) before and after application of GABA (2 μM) to isolated DRG neurones. Openings occurred rarely before application of GABA and were of very short duration (left panels). Note the smaller main current amplitude and shorter duration of γ2−/− GABAA receptor openings. The temporal expansion of the γ2+/+ receptor activity after application of GABA shows a single burst of openings containing eight to ten partially resolved closings. The temporal expansion of γ2−/− receptor activity shows three bursts indicated with double-headed arrows. They contain fewer openings and are of shorter duration than was typical for γ2+/+ bursts. B, GABA-gated openings are mediated by GABAA receptors. Openings evoked with 1 μM GABA in patches from γ2+/+ and γ2−/− hippocampal neurones in cell culture. They were reversibly blocked by coapplication of 40 μM bicuculline methochloride. The activity during bicuculline treatment could represent spontaneous openings of unliganded receptors. A, low-pass filtered 2 kHz (−3 dB), GABA applied via bath perfusion; B, low-pass filtered 1 kHz (−3 dB), GABA or GABA/bicuculline applied via microapplicator.
Figure 2
Figure 2. Immunochemical identification of GABAA receptor subunits in wild-type DRGs
Crude membranes of DRGs prepared from newborn mice were subjected to SDS-PAGE and Western blotting with affinity-purified antisera directed against the subunits indicated in the absence or presence of 10 μl ml−1 of the respective peptide antigen (+P). No peptide competition was performed with the monoclonal antibody bd-17, which recognizes the β2 and β3 subunits. Strong immunoreactivity was detected for the α2 (about 52 kDa), α3 (59–61 kDa), β2/3 (54–57 kDa) and γ2 (43–48 kDa) subunits. Staining for α1 (about 50 kDa) and γ3 (about 43 kDa) was faint. The γ1 protein (about 50 kDa) was not detected. For the γ2 subunit antiserum, additional specific immunoreactivity at higher molecular weight was observed. This immunoreactivity was also detected in crude brain membrane preparations and affinity-purified GABAA receptors, as well as with γ2 subunit antisera raised against different epitopes. It was therefore most probably caused by receptor aggregation.
Figure 3
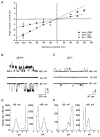
Figure 3. Voltage dependence of single-channel currents mediated by γ2+/+ and γ2−/− GABAA receptors
A, i-V plot for the main GABAA receptors of DRG neurones. Data are means ±s.e.m. of 3–20 patches at each potential for γ2+/+ (▪) and 3–11 patches for γ2−/− (▴). Linear regression lines were fitted using the potential range indicated by the arrows. ○, values derived from a patch from γ2+/+ hippocampal neurones recorded without TEA-Cl in the pipette solution. The currents of γ2+/+ GABAA receptors show inward rectification at positive holding potentials. B and C, main single-channel currents at the holding potentials indicated, low-pass filtered at 1 kHz (−3 dB). The γ2+/+ data are derived from the hippocampal patch shown in A, the γ2−/− data are derived from a DRG neurone. At 0 mV holding potential, close to the reversal potential for Cl, channel activity was undetectable. D and E, all-points amplitude histograms for the patches shown in B and C at negative and positive holding potentials. All trace segments containing 28 pS openings as shown in B or 12 pS openings as shown in C without superpositions were combined and fitted with two Gaussian components.
Figure 4
Figure 4. Conductance levels of GABAA receptors in DRG neurones
A, amplitude histograms from individual patches of γ2+/+, γ2+/− and γ2−/− DRG neurones. All openings recorded at −80 mV in response to 2–5 μM GABA with a duration of at least 415 μs were accepted. N = 2675 (γ2+/+), 872 (γ2+/−) and 2054 (γ2−/−); the chord conductance was calculated assuming Vrev= 0 mV. The insets show typical bursts of openings to different conductance levels present in the patch; low-pass filter 2 kHz (−3 dB). Three levels were generally found in patches from γ2+/+ and γ2+/− DRG neurones and two in γ2−/− patches. B, averages of results from histograms as shown in A. γ2+/+, N = 17 patches; γ2+/−, N = 7 patches; γ2−/−, N = 20 patches. The mean channel conductances (and relative areas) for γ2+/+ are: 28.4 ± 0.5 pS (82.3 ± 2.1 %), 18.3 ± 0.8 pS (14.5 ± 2.5 %) and 12.0 ± 0.6 pS (8.7 ± 1.3 %); for γ2+/−: 28.1 ± 0.9 pS (68.8 ± 5.5 %), 17.5 ± 0.9 pS (18.0 ± 2.9 %) and 11.3 ± 0.5 pS (21.5 ± 8.4 %); and for γ2−/−: 24.3 ± 0.6 pS (24.9 ± 5.6 %) and 11.9 ± 0.3 pS (75.1 ± 5.6 %). Note the increase in frequency of 12 pS openings in γ2+/− and γ2−/− patches and the appearance of a new 24 pS level in γ2−/− patches.
Figure 5
Figure 5. Main and subconductance states of γ2+/+ GABAA receptors
The traces represent recordings made at −80 mV and openings evoked with 1 μM GABA in the patch from the hippocampal neurone or 2 μM GABA for the DRG neurone; low-pass filtered 2 kHz (−3 dB). The shut level is indicated by a continuous line and open channel levels by dotted lines. Direct transitions (indicated by the arrow) can be seen between the main conductance level of about 28 pS and the sublevel of about 18 pS. The examples presented have been selected because of the long lifetime of the subconductance state and represent rather untypical events.
Figure 6
Figure 6. Open duration distributions of γ2+/+ and γ2−/− GABAA receptor main conductances in DRG neurones
A, open duration distributions of selected patches for the 28 pS main conductance in γ2+/+ receptors (upper row) and for the 12 pS main conductance in γ2−/− receptors (lower row) are shown at GABA concentrations of 0.5 (left panels) and 5 μM (right panels). The distributions include openings of at least 0.2 ms duration and were fitted with three exponential components. The parameters are indicated as insets (time constants (τ, ms) and relative areas (%) of components O1, O2 and O3). B, averages ±s.e.m. of fitted time constants and relative areas from all patches analysed at GABA concentrations of 0.5, 2 and 5 μM for 28 pS γ2+/+ receptors (upper row) and 12 pS γ2−/− receptors (lower row). The time constants of O1, O2 and O3 were not affected by changes in GABA concentration in either genotype (left panels). Time constants for O1, O2 and O3 over all three concentrations (0.5, 2 and 5 μM) averaged (±s.e.m.): in γ2+/+, 0.4 ± 0.04 ms (N = 16), 1.5 ± 0.1 ms (N = 15) and 5.7 ± 0.4 ms (N = 14), and in γ2−/−, 0.6 ± 0.03 ms (N = 19), 2.4 ± 0.3 ms (N = 17) and 8.7 ± 0.5 ms (N = 7). The fastest components (O1) in 28 pS γ2+/+ and 12 pS γ2−/− GABAA receptors were reduced in area at higher GABA concentrations whereas longer components (O2, O3) increased (right panels). *P < 0.05 (Mann-Whitney U test) for comparison with the area at 0.5 μM GABA.
Figure 9
Figure 9. Burst properties of γ2+/+ and γ2−/− GABAA receptor main conductances in DRG neurones
A, distributions of burst durations were fitted with three exponential components. Averages ±s.e.m. of time constants (left panels) and relative areas (right panels) of components obtained from all individual fits at GABA concentrations of 0.5, 2 and 5 μM. The slowest component of 28 pS γ2+/+ and 12 pS γ2−/− receptors (B3) increased significantly in relative area at higher GABA concentrations whereas the fastest component (B1) decreased (*P < 0.05, **P < 0.01; Mann-Whitney U test for comparison with the area at 0.5 μM GABA). Time constants B1, B2 and B3 were not dependent on the GABA concentration and they averaged ±s.e.m. over all three concentrations in γ2+/+: 0.3 ± 0.03, 2.3 ± 0.3 and 23.1 ± 1.7 ms (N = 16, 15 and 13, respectively) and in γ2−/− they averaged ±s.e.m.: 0.4 ± 0.1, 2.7 ± 0.3 and 9.0 ± 1.4 ms (N = 19, 19 and 11, respectively). B, distributions of the number of openings per burst were fitted with two geometric components representing simple (O/B1) and complex bursts (O/B2). The parameters fitted were the mean number of openings per burst, μ (N), and the relative areas (%). Averages ±s.e.m. for parameters obtained from all fits at GABA concentrations of 0.5, 2 and 5 μM are shown. The upper and lower right panels show that complex bursts (O/B2) increased in relative area and simple bursts (O/B1) decreased at higher GABA concentrations in γ2+/+ and γ2−/− (*P < 0.05,**P < 0.01; Mann-Whitney U test for comparison with the area at 0.5 μM GABA). The panels on the left show that the mean number of openings per burst for components O/B1 and O/B2 did not depend on the GABA concentration. They averaged ±s.e.m. over all three concentrations in γ2+/+: 1.2 ± 0.02 (N = 15) and 5.3 ± 0.3 (N = 14) and in γ2−/−: 1.2 ± 0.02 (N = 19) and 2.2 ± 0.1 (N = 15).
Figure 7
Figure 7. Shut time distributions of γ2+/+ and γ2−/− GABAA receptor main conductances in DRG neurones
A, selected distributions of shut times separating 28 pS openings of γ2+/+ receptors (upper row) and 12 pS openings of γ2−/− receptors (lower row) are shown at GABA concentrations of 0.5 (left panels) and 5 μM (right panels), respectively. The distributions include shut times of at least 0.3 ms duration and were fitted with four exponential components. The resulting parameters for components S1 to S4 are shown as insets (time constants (ms) and relative areas (%)). B, means ±s.e.m. of parameters obtained from all individual fits at GABA concentrations of 0.5, 2 and 5 μM for 28 pS γ2+/+ (upper row) and 12 pS γ2−/− receptors (lower row). Note that the two fastest components, S1 and S2, in γ2+/+ (upper right panel) increased significantly in relative area at higher GABA concentrations while only the fastest component, S1, increased significantly in γ2−/− GABAA receptors (lower right panel). This suggests a reduction in the number of shut time components within γ2−/− bursts. *P < 0.05 (Mann-Whitney U test) for comparison with the area at 0.5 μM GABA.
Figure 8
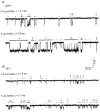
Figure 8. Bursts of γ2+/+ and γ2−/− GABAA receptor main conductances at different GABA concentrations
Representative recordings of single-channel openings in DRG membrane patches at the indicated GABA concentration. All four traces are from different patches. Each burst is marked: unlabelled dots in A and B represent bursts of single openings, and the remaining bursts are labelled with the number of openings they contain. A, 28 pS γ2+/+ GABAA receptors. Note the frequent occurrence of bursts containing many individual openings of long duration at the higher concentration. B, 12 pS γ2−/− GABAA receptors. Bursts of longer duration and containing more openings also occurred more frequently at higher concentrations but the difference was less pronounced compared with 28 pS receptors. A and B low-pass filtered 2 kHz (−3 dB).

References

    1. Amico C, Cupello A, Fossati C, Robello M. Involvement of phosphatase activities in the run-down of GABA(A) receptor function in rat cerebellar granule cells in culture. Neuroscience. 1998;84:529–535. - PubMed
    1. Angelotti TP, Macdonald RL. Assembly of GABAA receptor subunits: alpha 1 beta 1 and alpha 1 beta 1 gamma 2S subunits produce unique ion channels with dissimilar single-channel properties. Journal of Neuroscience. 1993;13:1429–1440. - PMC - PubMed
    1. Angelotti TP, Uhler MD, Macdonald RL. Assembly of GABAA receptor subunits: analysis of transient single-cell expression utilizing a fluorescent substrate/marker gene technique. Journal of Neuroscience. 1993;13:1418–1428. - PMC - PubMed
    1. Barnard EA, Skolnick P, Olsen RW, Mohler H, Sieghart W, Biggio G, Braestrup C, Bateson AN, Langer SZ. International Union of Pharmacology. XV. Subtypes of gamma-aminobutyric acidA receptors: classification on the basis of subunit structure and receptor function. Pharmacological Reviews. 1998;50:291–313. - PubMed
    1. Benke D, Honer M, Michel C, Mohler H. GABAA receptor subtypes differentiated by their gamma-subunit variants: prevalence, pharmacology and subunit architecture. Neuropharmacology. 1996;35:1413–1423. - PubMed

Publication types

MeSH terms

LinkOut - more resources