. 2000 Aug 15;527 Pt 1(Pt 1):55-69.
doi: 10.1111/j.1469-7793.2000.00055.x.

Functional profile of the giant metacerebral neuron of Helix aspersa: temporal and spatial dynamics of electrical activity in situ

Affiliations

Functional profile of the giant metacerebral neuron of Helix aspersa: temporal and spatial dynamics of electrical activity in situ

S Antic et al. J Physiol. .

Abstract

1. Understanding the biophysical properties of single neurons and how they process information is fundamental to understanding how the brain works. However, action potential initiation and the preceding integration of the synaptic signals in neuronal processes of individual cells are complex and difficult to understand in the absence of detailed, spatially resolved measurements. Multi-site optical recording with voltage-sensitive dyes from individual neurons in situ was used to provide these kinds of measurements. We analysed in detail the pattern of initiation and propagation of spikes evoked synaptically in an identified snail (Helix aspersa) neuron in situ. 2. Two main spike trigger zones were identified. The trigger zones were activated selectively by different sets of synaptic inputs which also produced different spike propagation patterns. 3. Synaptically evoked action potentials did not always invade all parts of the neuron. The conduction of the axonal spike was regularly blocked at particular locations on neuronal processes. 4. The propagating spikes in some axonal branches consistently reversed direction at certain branch points, a phenomenon known as reflection. 5. These experimental results, when linked to a computer model, could allow a new level of analysis of the electrical structure of single neurons.


Figures

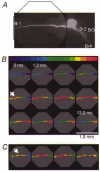
Figure 1
Figure 1. The giant metacerebral interneuron of H. aspersa
A, fluorescence image of a metacerebral cell in situ. The cell body and the processes are close to the surface of the ganglion and clearly visible in the unfixed preparation. Excitation, 540 ± 30 nm; dichroic mirror, 570 nm; barrier filter, 610 nm. Br1, cerebral commissure; Br4 and Br7, left and right cerebrobuccal connectives; Br3 and Br6, left and right external lip nerve; Br5 and Br8, left and right internal lip nerve. B and C, fine arborizations of dendritic branches, from the part of the neuron indicated in A, as revealed by cobalt-lysine intracellular staining. Images in A and in B and C are from different cells.
Figure 2
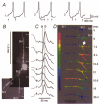
Figure 2. Position of the trigger zone for spikes evoked by ipsilateral EPSPs and soma stimulation
A, raw optical recordings of fluorescence signals (ΔF/F) associated with 85 mV action potentials from elements of photodiode array positioned over the fluorescence CCD image of the axonal arborizations of a metacerebral cell in situ, stained with the voltage-sensitive dye JPW 1114. In this and all subsequent figures the traces are arranged according to the disposition of the detectors in the array. A mask was applied to the recordings in A that revealed the data from relevant detectors only. Nine trials were averaged. Each diode received light from a 50 μm × 50 μm area in the object plane. Each trace represents the output of one diode for 100 ms centred around an evoked action potential. B, synaptically evoked action potential recorded by a microelectrode in the soma. C, superimposed recordings from individual detectors from different locations indicated in A, scaled to the same height, on an expanded time scale. D, colour-coded representation of the spatial and temporal dynamics of the synaptically evoked spike. The peak of the action potential is shown in red. Individual frames are separated by 0.6 ms and the position of the ipsilateral trigger zone is indicated by the arrow. E, position of the ipsilateral trigger zone (arrow) for the action potential evoked by direct stimulation of the soma under identical recording conditions to those in D.
Figure 3
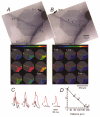
Figure 3. Propagation of an action potential initiated by EPSPs evoked by electrical stimulation of the ipsilateral middle lip nerve
A, two separate recordings were obtained from the ipsi- and contralateral side of the cell as indicated on a CCD image of the neuron by the outline of an octagonal array on each side of the soma. B, pattern of spike propagation shown by comparing optical recordings from six different regions, indicated by rectangles on the CCD image of the cell. Vertical lines a and b indicate peaks of the first spike (trace 7) and the intrasomatic action potential (trace 3), respectively. C, spatial and temporal characteristics of spike propagation shown as a colour-coded display of the data from the same measurement. Nine trials were averaged. The position of the ipsilateral trigger zone is indicated by the arrow. See text for explanation.
Figure 4
Figure 4. Position of the trigger zone for spikes evoked by contralateral EPSPs and soma stimulation
A, optical recording was made from a 1.3 mm region on axonal branch Br1, as indicated by the outline of the octagonal array superimposed over the CCD image of the cell in situ.B, colour-coded representation of the spatial and temporal dynamics of the synaptically evoked action potential. Individual frames are separated by 1.2 ms. The position of the trigger zone is indicated by the arrow. Nine trials were averaged. C, position of the contralateral trigger zone (arrow) for the action potential evoked by direct stimulation of the soma under identical recording conditions to those in B.
Figure 5
Figure 5. Pattern of initiation and propagation of the nerve impulse evoked in the contralateral trigger zone by polysynaptic EPSPs
A, composite CCD image of the neuron in situ. Two measurement series of nine averaged trials were made from different regions of the cell, as indicated by the outline of an octagonal array on each side of the soma. B, pattern of spike propagation obtained by comparing optical recordings from six different regions, indicated by rectangles in A. Trace 3 is an electrical recording from the soma. C, colour-coded display of the same data showing the spatial and temporal dynamics of the spike generation and propagation. See text for explanation.
Figure 6
Figure 6. Initiation and propagation of action potentials evoked by spontaneous EPSPs
A, action potentials evoked by spontaneous EPSPs (arrows), recorded with the microelectrode in the soma during three optical recording trials (1–3). B, CCD image of the neuron in situ.C, pattern of spike propagation shown by comparing optical recordings from seven different regions, indicated by rectangles in B. Trace 4 is an electrical recording from the soma. D, colour-coded display of the same data showing the spatial and temporal dynamics of the spike generation and propagation. Single trial recording. See text for explanation.
Figure 7
Figure 7. Multiple site recording of spike propagation success (A) and failure (B) at the junction between axonal branches Br5 and Br2
The recording area is indicated by multiple traces superimposed over the CCD image of the same intact neuron. Each trace represents the output of one diode for 70 ms centred around the peak of the spike. Four trials were averaged. The spatial and temporal characteristics of the propagation block are shown as a sequence of nine frames, 1 ms apart, in the colour-coded display. A, orthodromic action potential evoked by soma stimulation invaded all axonal branches. B, antidromic action potential evoked peripherally in Br5, by a current pulse delivered through a suction electrode attached to the cut end of the peripheral nerve, failed at the bifurcation. C and D, decline of the relative spike amplitude with distance from the region of full excitability in the direction of the site of propagation block. In D, the y-axis shows the relative spike amplitude.
Figure 8
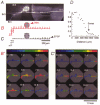
Figure 8. Multiple site recording of spike propagation failure at the junction between axonal branch Br1 and the soma
In A, the recording region is indicated by an outline of a subset of individual detectors, superimposed over a CCD image of the neuron in situ.B, multiple site recording of the propagation of an action potential evoked by direct stimulation of the soma. Each trace is the output of one diode for 100 ms centred around the peak of the spike. Each diode received light from a region of 14 μm × 14 μm in the object plane. Nine trials were averaged. C, propagation of an action potential evoked by a contralateral EPSP, recorded under identical conditions to those in B. B′ and C′, colour-coded representation of the data shown in B and C. The orthodromic spike evoked by soma stimulation was propagated throughout the neuron (B′). Propagation of the antidromic nerve impulse was blocked in the vicinity of the cell body (C′). D, relative spike amplitude (y-axis) as a function of the distance from the region of full excitability in the direction of the site of propagation block.

Similar articles

Cited by

References

    1. Altrup U, Peters M. Procedure of intracellular staining of neurons in the snail Helix pomatia. Journal of Neuroscience Methods. 1982;5:161–165. - PubMed
    1. Antic S, Zecevic D. Optical signals from neurons with internally applied voltage-sensitive dyes. Journal of Neuroscience. 1995;15:1392–1405. - PMC - PubMed
    1. Baccus SA. Synaptic facilitation by reflected action potentials: enhancement of transmission when nerve impulses reverse direction at axon branch points. Proceedings of the National Academy of Sciences of the USA. 1998;95:8345–8350. - PMC - PubMed
    1. Baccus SA, Burrell BD, Sahley CL, Muller KJ. Action potential reflection and failure at axon branch points cause stepwise changes in EPSPs in a neuron essential for learning. Journal of Neurophysiology. 2000;83:1693–1700. - PubMed
    1. Bullock TH, Terzuolo CA. Diverse forms of activity in the somata of spontaneous and integrating ganglion cells. The Journal of Physiology. 1957;138:341–364. - PMC - PubMed

Publication types

Substances

LinkOut - more resources