

Global warming in the twenty-first century: an alternative scenario
- PMID: 10944197
- PMCID: PMC27611
- DOI: 10.1073/pnas.170278997
Global warming in the twenty-first century: an alternative scenario
Abstract
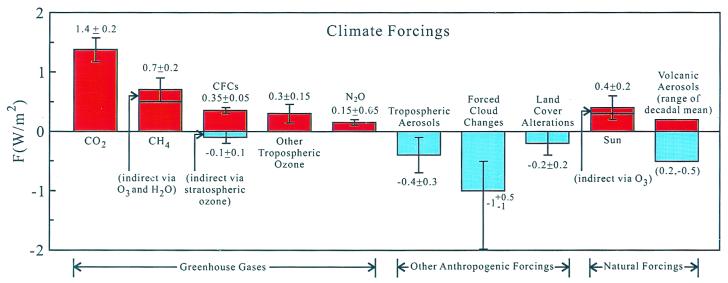
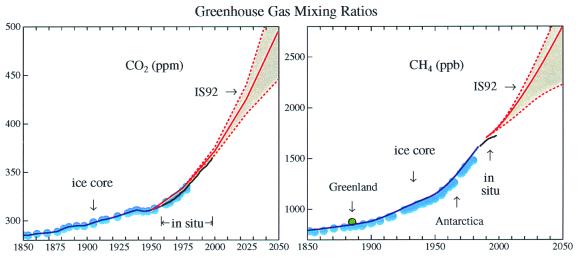
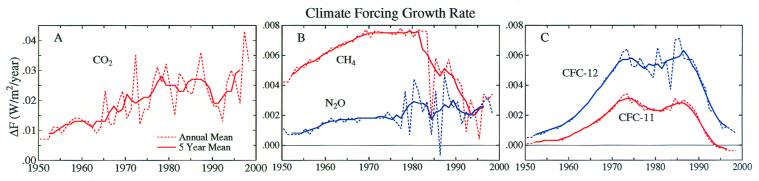
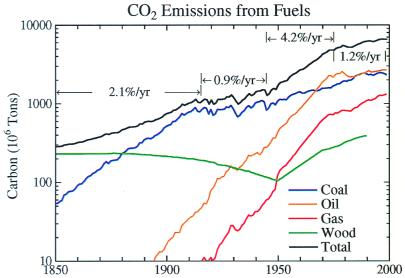
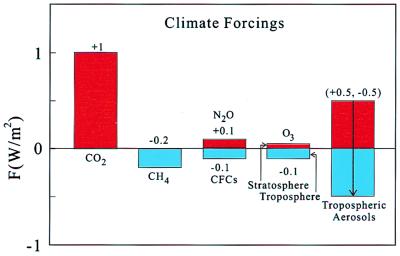
A common view is that the current global warming rate will continue or accelerate. But we argue that rapid warming in recent decades has been driven mainly by non-CO(2) greenhouse gases (GHGs), such as chlorofluorocarbons, CH(4), and N(2)O, not by the products of fossil fuel burning, CO(2) and aerosols, the positive and negative climate forcings of which are partially offsetting. The growth rate of non-CO(2) GHGs has declined in the past decade. If sources of CH(4) and O(3) precursors were reduced in the future, the change in climate forcing by non-CO(2) GHGs in the next 50 years could be near zero. Combined with a reduction of black carbon emissions and plausible success in slowing CO(2) emissions, this reduction of non-CO(2) GHGs could lead to a decline in the rate of global warming, reducing the danger of dramatic climate change. Such a focus on air pollution has practical benefits that unite the interests of developed and developing countries. However, assessment of ongoing and future climate change requires composition-specific long-term global monitoring of aerosol properties.
Figures
Comment in
-
Human forcing of climate change: easing up on the gas pedal.Proc Natl Acad Sci U S A. 2000 Sep 12;97(19):10304-6. doi: 10.1073/pnas.97.19.10304. Proc Natl Acad Sci U S A. 2000. PMID: 10984528 Free PMC article. No abstract available.
References
-
- Hansen J, Ruedy R, Glascoe J, Sato M. J Geophys Res. 1999;104:30997–31022.
-
- Jones P D, New M, Parker D E, Martin S, Rigor I G. Rev Geophys. 1999;37:173–199.
-
- Mann M E, Bradley R S, Hughes M K. Geophys Res Lett. 1999;26:759–762.
-
- Houghton J T, Meira Filho L G, Callander B A, Harris N, Kattenberg A, Maskell K, editors. Intergovernmental Panel on Climate Change. Climate Change 1995. Cambridge, U.K.: Cambridge Univ. Press; 1996.
-
- Hansen J, Sato M, Ruedy R. J Geophys Res. 1997;102:6831–6864.
MeSH terms
Substances
LinkOut - more resources
Full Text Sources
Other Literature Sources
Miscellaneous
