

doi: 10.1073/pnas.97.17.9482.
Myosin-V stepping kinetics: a molecular model for processivity
Affiliations
- PMID: 10944217
- PMCID: PMC16890
- DOI: 10.1073/pnas.97.17.9482
Item in Clipboard
Myosin-V stepping kinetics: a molecular model for processivity
Proc Natl Acad Sci U S A.
.
Abstract
Myosin-V is a molecular motor that moves processively along its actin track. We have used a feedback-enhanced optical trap to examine the stepping kinetics of this movement. By analyzing the distribution of time periods separating discrete approximately 36-nm mechanical steps, we characterize the number and duration of rate-limiting biochemical transitions preceding each such step. These data show that myosin-V is a tightly coupled motor whose cycle time is limited by ADP release. On the basis of these results, we propose a model for myosin-V processivity.
Figures
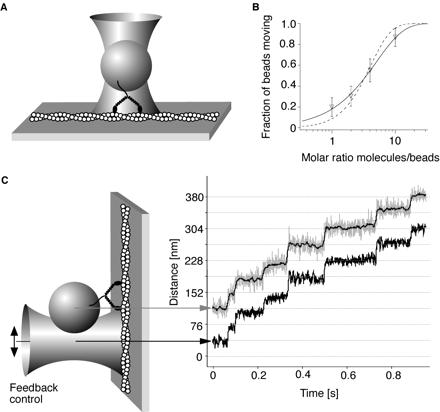
(A) Experimental scheme for single-molecule myosin-V experiments. (B) The fraction of beads moving continuously (>four steps) along actin is recorded as a function of the molar ratio of incubated beads to myosin-V molecules. Values are displayed as mean ±√[f⋅(1-f)/N]. The probability that a bead carries one or more motors is 1-exp(−λc), where c is the molar ratio of myosin-V molecules to beads during the incubation and λ is a fit parameter (12) accounting for the fact that not all myosin-V molecules incubated together with the beads will find a bead or adsorb in a functional conformation. The data can be well fit by this functional form (solid line, λ = 0.2, reduced χ2 = 0.04), showing that a single molecule is sufficient to move a bead. The data cannot be fit assuming that two or more molecules per bead are required for movement (dashed line, reduced χ2 = 0.98). When the trap was turned off during processive stepping, the bead continued to advance for >1 μm before dissociating. (C) Experimental scheme of the force feedback enhanced laser trap. A feedback loop keeps the distance between the bead center (gray curve) and the trap center (lower black curve) constant as the myosin-V molecule steps along the actin filament. Thus the myosin-V molecule is always kept under constant load. The thin black line within the gray curve is a filtered bead position signal (box filter, 15 ms).
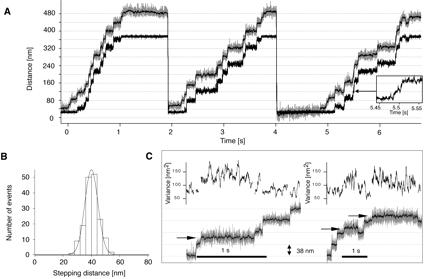
(A) Stepping record of a single myosin-V molecule at 2 mM ATP and 1 pN. The bead position is shown in gray. The superimposed black line is the filtered bead position data (15 ms box filter). The lower black trace marks the position of the trap center. (B) Histogram of step sizes measured at 2 mM ATP and 1 pN. The black line is a Gaussian fit to the data (mean = 40.2 nm, standard deviation = 6.4 nm). (C) Two sample traces for stepping at high loads (2 pN). Among the regular steps of 40 nm, steps of intermediate size (arrows) can also be observed. The increased variance (curves above each trace) indicates higher conformational flexibility/fluctuations within the system connecting the bead to the surface, through the myosin molecule and its actin connection.
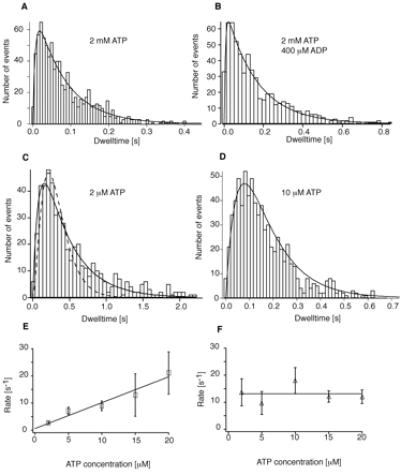
(A) Histogram of dwell times at 2 mM ATP and 1 pN. All histograms shown contain only durations of dwell periods preceding forward steps. The solid line is a fit to [k1⋅k2/(k1 − k2)](e−k2⋅t − e−k1⋅t) assuming two rates, yielding k1 = 150 s−1 and k2 = 12.5 s−1. (B) Histogram of dwell times at 2 mM ATP and 0.4 mM ADP. Fit parameters are k1 = 161 s−1 and k2 = 6.4 s−1. (C) Histogram of dwell times at 2 μM ATP. The solid line is a fit to the same equation as in A and B, yielding k1 = 2.7 s−1 and k2 = 13.8 s−1. The dashed line is a fit assuming sequential binding two ATP molecules at similar rates. (D) Histogram of dwell times at 10 μM ATP. Fit parameters are k1 = 9 s−1 and k2 = 17 s−1. (E and F) Rate constants obtained from fits to histograms recorded at varying ATP concentrations. One of the rate constants is independent of ATP concentrations and averages to 13 s−1 (E); the other rate constant is linearly dependent on ATP concentrations (F). The rate of 150 s−1 observed at saturating ATP was too fast to be detected at limiting ATP conditions (no significant change in χ2) and was therefore not included in the fits to these histograms. The slope of the ATP-dependent rate constants provides a second-order ATP binding constant of 0.9 μM−1 s−1. Error bars represent the standard deviation of the rates obtained from fits to 100 simulated histograms for each ATP concentration.
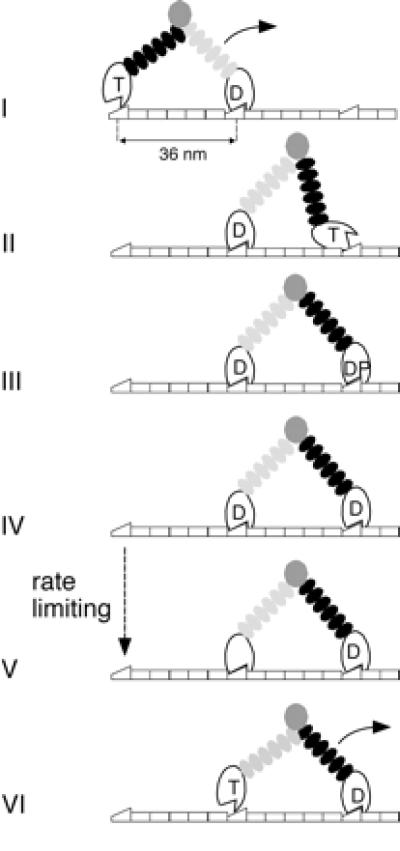
Model for myosin-V stepping (see text).
Comment in
-
A large step for myosin.Proc Natl Acad Sci U S A. 2000 Aug 15;97(17):9357-9. doi: 10.1073/pnas.97.17.9357. Proc Natl Acad Sci U S A. 2000. PMID: 10944206 Free PMC article. No abstract available.
References
-
- Cheney R E, O'Shea M K, Heuser J E, Coelho M V, Wolenski J S, Espreafico E M, Forscher P, Larson R E, Mooseker M S. Cell. 1993;75:13–23. - PubMed
-
- Reck-Peterson S L, Provance D W, Jr, Mooseker M S, Mercer J A. Biochim Biophys Acta. 2000;1496:36–51. - PubMed
-
- Howard J. Nature (London) 1997;389:561–567. - PubMed
-
- Mehta A D, Rock R S, Rief M, Spudich J A, Mooseker M S, Cheney R E. Nature (London) 1999;400:590–593. - PubMed
-
- Hackney D D. Annu Rev Physiol. 1996;58:731–750. - PubMed
Publication types
MeSH terms
Substances
Grants and funding
LinkOut - more resources
Full Text Sources
