. 2000 Sep;44(9):2276-85.
doi: 10.1128/AAC.44.9.2276-2285.2000.

Contribution of a thickened cell wall and its glutamine nonamidated component to the vancomycin resistance expressed by Staphylococcus aureus Mu50

Affiliations

Contribution of a thickened cell wall and its glutamine nonamidated component to the vancomycin resistance expressed by Staphylococcus aureus Mu50

L Cui et al. Antimicrob Agents Chemother. 2000 Sep.

Abstract

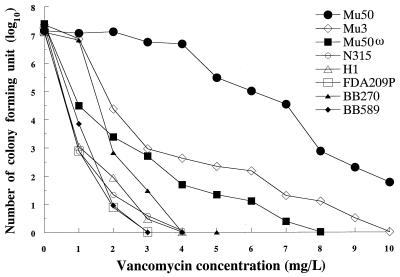
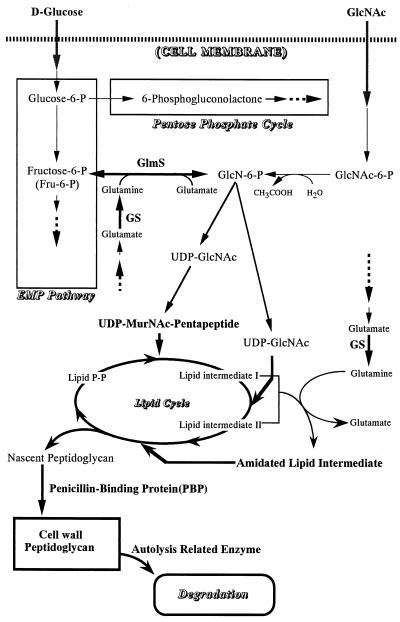
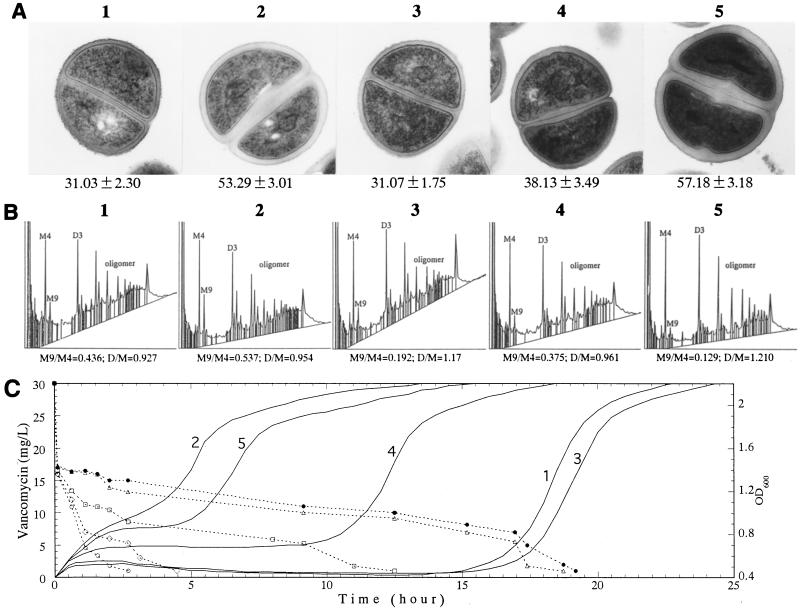
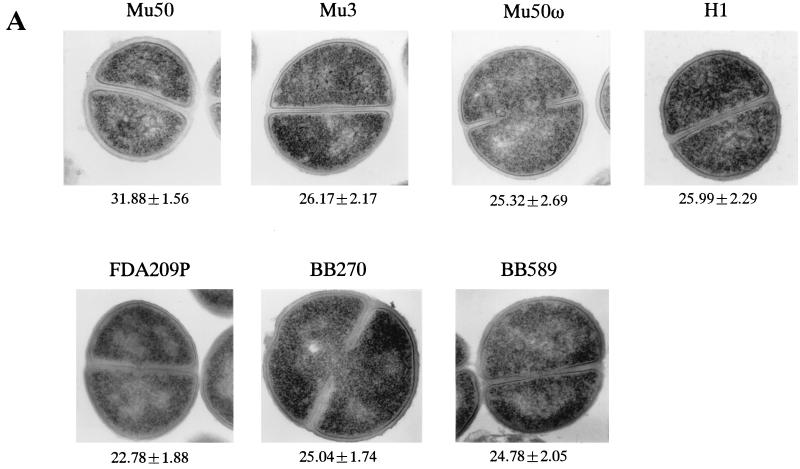
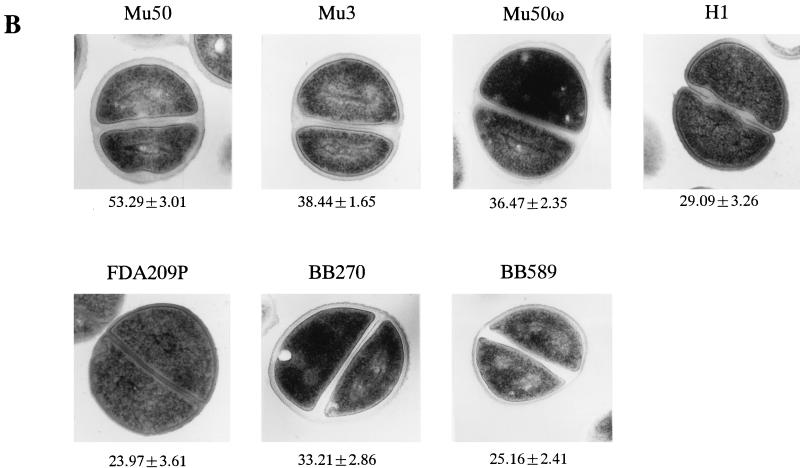
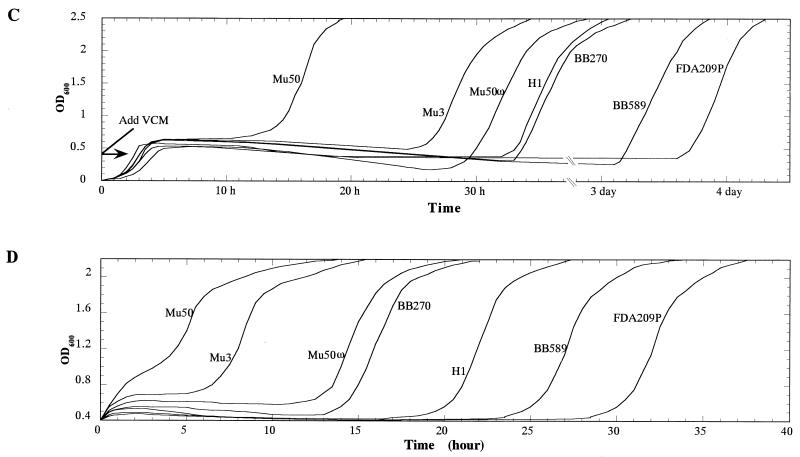
Staphylococcus aureus Mu50, which has reduced susceptibility to vancomycin, has a remarkably thickened cell wall with an increased proportion of glutamine nonamidated muropeptides. In addition, Mu50 had enhanced glutamine synthetase and L-glutamine D-fructose-6-phosphate aminotransferase activities, which are involved in the cell-wall peptidoglycan synthesis pathway. Furthermore, significantly increased levels of incorporation of (14)C-labeled D-glucose into the cell wall was observed in Mu50. Unlike a femC mutant S. aureus strain, increased levels of production of nonamidated muropeptides in Mu50 was not caused by lower levels of glutamine synthetase activity but was considered to be due to the glutamine depletion caused by increased glucose utilization by the cell to biosynthesize increased amounts of peptidoglycan. After the cells were allowed to synthesize cell wall in the absence or presence of glucose and glutamine, cells with different cell-wall thicknesses and with cell walls with different levels of cross-linking were prepared, and susceptibility testing of these cells demonstrated a strong correlation between the cell-wall thickness and the degree of vancomycin resistance. Affinity trapping of vancomycin molecules by the cell wall and clogging of the outer layers of peptidoglycan by bound vancomycin molecules were considered to be the mechanism of vancomycin resistance of Mu50. The reduced cross-linking and the increased affinity of binding to vancomycin of the Mu50 cell wall presumably caused by the increased proportion of nonamidated muropeptides may also contribute to the resistance to some extent.


Figures

FIG. 1
FIG. 1
Analysis of vancomycin-resistant subpopulations of S. aureus strains used in this study. The population patterns of Mu50, Mu3, H1, and FDA209P have been described previously (11). Strain Mu50ω also showed a pattern of heterogeneous-type resistance to vancomycin, as did Mu3. femC mutant strain BB589 as well as its parent strain, BB270, exhibited vancomycin-susceptible population curves, as did H1 and FDA209P.
FIG. 2
FIG. 2
Metabolic pathways for the synthesis of cell-wall peptidoglycan. Two major biosynthetic pathways supply UDP-GlcNAc, the cardinal precursor metabolite for cell-wall peptidoglycan. Two enzymes involved in the cell-wall synthesis pathways require glutamine as the NH4+ donor for the amidation reaction catalyzed by the enzymes: GlmS catalyzes the conversion of Fru-6-P to GlcN-6-P, and a putative enzyme catalyzes the amidation of iso-glutamate of the murein monomer precursor (in the form of lipid I or II). GS helps the activities of these enzymes by supplying glutamine by assimilating ammonia into glutamate.
FIG. 3
FIG. 3
Rate of cell-wall synthesis and GS and GlmS activities of Mu50. (A) The rates of 14C-labeled d-glucose incorporation into the cell wall among the test strains were compared. The time course of incorporation of 14C-labeled d-glucose into the cell walls in RMg− was evaluated. Symbols: closed triangle, Mu50; small closed circle, Mu3; large open triangle, H1; small open triangle, Mu50ω; large closed circle, N315; open circle, FDA209P. (B) GlmS and GS activities in Mu50 and other test strains. Bacteria in the logarithmic growth phase were harvested for measurement of the enzyme activities as described in Materials and Methods. GS was tested for both its biosynthetic (glutamine synthetase) and its transferase (glutamyltransferase) activities. ND, not done. (C) Effect of l-glutamine on rate of glucose incorporation. The rates of incorporation of 14C-labeled d-glucose into the cell walls of test strains in medium containing various concentrations of l-glutamine were compared. The bacterial culture in BHI medium was harvested at an OD578 of 0.7, washed twice with RMg−, and incubated in RMg− with various concentration of l-glutamine 30 min before the addition of radioactive glucose. The values shown are those obtained at 20 min in the incorporation assay. Note that in the case of Mu50, more than twice the amount of glucose was incorporated in the presence of 10 mM glutamine.
FIG. 4
FIG. 4
Correlation between the cell-wall thickness, cell-wall structure, and TRG in the presence of vancomycin in Mu50. Mu50 was grown in BHI medium to an OD600 of 0.7, washed twice with RMg− and then incubated at 37°C for 2 h with shaking in either one of the following media: RMg− (panels 1), RM (RMg− plus 30 mM d-glucose) (panels 2), RMg− plus 30 mM l-glutamine (panels 3), RMg− plus 30 mM GlcNAc (panels 4), and RM plus 30 mM l-glutamine (panels 5). The cells were analyzed for cell-wall thickness by transmission electron microscopy (A), cell-wall composition by HPLC (B), and the level of resistance by observing the cell growth in BHI medium containing 30 μg of vancomycin (solid line in panel C) per ml. The vancomycin concentration in the medium was determined by bioassay, as described in Materials and Methods, by using the sterile filtrates of the culture at various times after the initiation of culture (broken line in panel C). Magnification in panel A, ×22,500. M9/M4 and D/M in panel B indicate the ratio of the peak area of the glutamine-nonamidated monomer (M9 peak) versus that of the amidated monomer (M4 peak) and the ratio of the total area of dimer peaks versus that of monomer peaks (8), respectively. The numbers used to label the panels and lines in panels A, B, and C correspond to one another. The values given under each picture in panel A are the means and SDs of the cell wall thickness (in nanometers). In panel C, the symbols for the broken lines (vancomycin concentration) correspond to the numerals for the solid lines (cell growth), as follows: ▵, 1; ○, 2; ●, 3; □, 4; ◊, 5.
FIG. 5
FIG. 5
Comparison of cell-wall thickness and TRG in the presence of vancomycin among the test strains after cultivation (or incubation) in BHI medium and RM. (A and B) Comparison of cell-wall thicknesses of the test strains cultivated in BHI medium (A) and after further incubation in RM (B). The values under each panel are mean ± SD thicknesses (in nanometers). The bacterial cultures at an OD600 of 0.7 in BHI medium were divided into two portions. One of them was directly subjected to electron microscopy (A). The other portion was washed twice with RMg−, further incubated in RM at 37°C for 2 h, and then subjected to electron microscopic examination (B). (C and D) TRG was compared among the cell preparations shown in panels A (C) and B (D). (C) Vancomycin was added to a final concentration of 30 mg/liter when the culture (inoculated with the cells shown in p1anel A at an initial concentration of 106 cells/ml) reached an OD600 of 0.4. (D) Cells incubated in RM were spun down and resuspended in BHI medium containing vancomycin at 30 mg/liter.
FIG. 5
FIG. 5
Comparison of cell-wall thickness and TRG in the presence of vancomycin among the test strains after cultivation (or incubation) in BHI medium and RM. (A and B) Comparison of cell-wall thicknesses of the test strains cultivated in BHI medium (A) and after further incubation in RM (B). The values under each panel are mean ± SD thicknesses (in nanometers). The bacterial cultures at an OD600 of 0.7 in BHI medium were divided into two portions. One of them was directly subjected to electron microscopy (A). The other portion was washed twice with RMg−, further incubated in RM at 37°C for 2 h, and then subjected to electron microscopic examination (B). (C and D) TRG was compared among the cell preparations shown in panels A (C) and B (D). (C) Vancomycin was added to a final concentration of 30 mg/liter when the culture (inoculated with the cells shown in p1anel A at an initial concentration of 106 cells/ml) reached an OD600 of 0.4. (D) Cells incubated in RM were spun down and resuspended in BHI medium containing vancomycin at 30 mg/liter.

References

    1. Aeschlimann J R, Hershberger E, Rybak M J. Analysis of vancomycin population susceptibility profiles, killing activity, and postantibiotic effect against vancomycin-intermediate Staphylococcus aureus. Antimicrob Agents Chemother. 1999;43:1914–1918. - PMC - PubMed
    1. Bearne S L. Active site-directed inactivation of Escherichia coli glucosamine-6-phosphate synthase. Determination of the fructose 6-phosphate binding constant using a carbohydrate-based inactivator. J Biol Chem. 1996;271:3052–3057. - PubMed
    1. Fisher S H, Sonenshein A L. Bacillus subtilis glutamine synthetase mutants pleiotropically altered in glucose catabolite repression. J Bacteriol. 1984;157:612–621. - PMC - PubMed
    1. Ghosh S, Blumenthal H J, Davidson E, Roseman S. Glucosamine metabolism. V. Enzymatic synthesis of glucosamine-6-phosphate. J Biol Chem. 1960;235:1265–1273. - PubMed
    1. Gustafson J, Strassle A, Hachler H, Kayser F H, Berger-Bachi B. The femC locus of Staphylococcus aureus required for methicillin resistance includes the glutamine synthetase operon. J Bacteriol. 1994;176:1460–1467. - PMC - PubMed

Publication types

LinkOut - more resources