Comparative Study
. 2000 Sep;44(9):2296-303.
doi: 10.1128/AAC.44.9.2296-2303.2000.

Transcriptional analyses of antifungal drug resistance in Candida albicans

Affiliations
Comparative Study

Transcriptional analyses of antifungal drug resistance in Candida albicans

C N Lyons et al. Antimicrob Agents Chemother. 2000 Sep.

Abstract

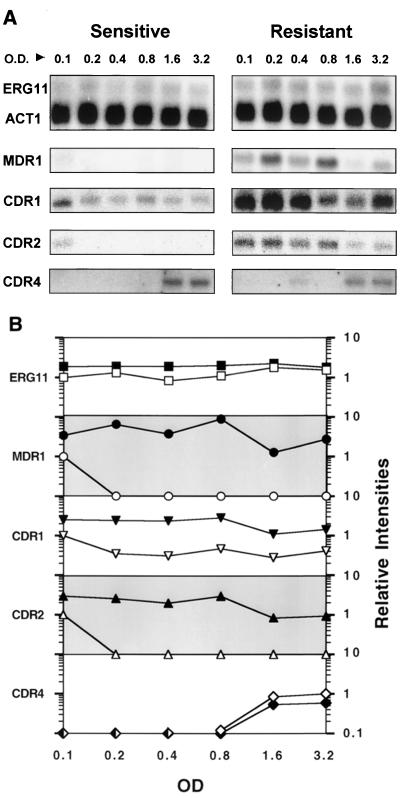
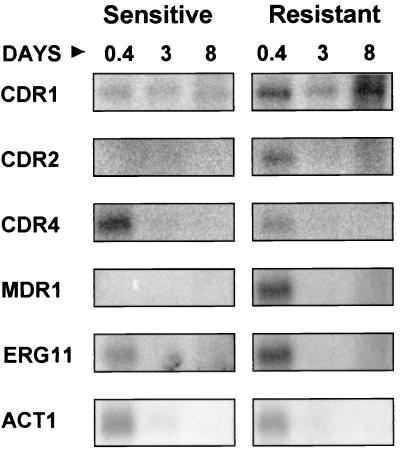
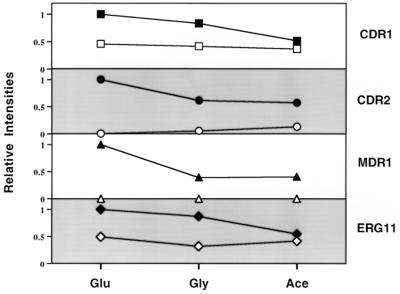
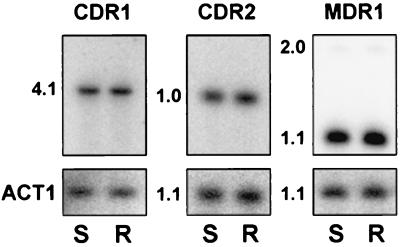
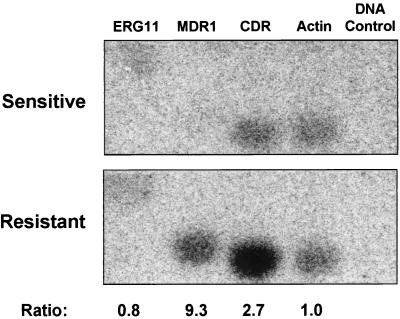
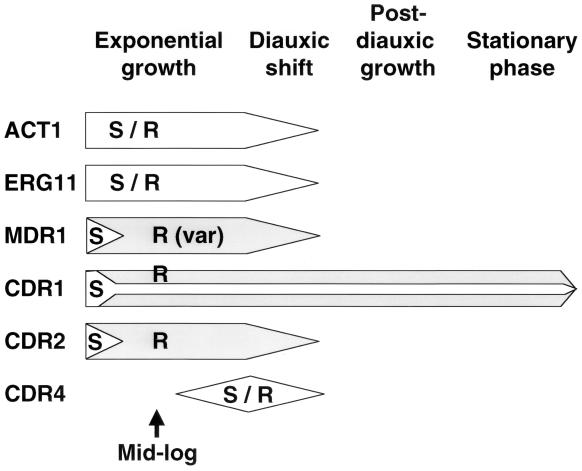
Oral infections with the pathogenic yeast Candida albicans are one of the most frequent and earliest opportunistic infections in human immunodeficiency virus-infected patients. The widespread use of azole antifungal drugs has led to the development of drug-resistant isolates. Several molecular mechanisms that contribute to drug resistance have been identified, including increased mRNA levels for two types of efflux pump genes: the ATP binding cassette transporter CDRs (CDR1 and CDR2) and the major facilitator MDR1. Using Northern blot analyses, the expression patterns of these genes have been determined during logarithmic and stationary phases of cell growth and during growth in different carbon sources in a set of matched susceptible and fluconazole-resistant isolates that have been characterized previously. MDR1, CDR1, and CDR2 are expressed early during logarithmic growth, CDR4 is expressed late during logarithmic growth, and CDR1 is preferentially expressed in stationary-phase cells. There is a small decrease in expression of these genes when the cells are grown in carbon sources other than glucose. While increased mRNA levels of efflux pump genes are commonly associated with azole resistance, the causes of increased mRNA levels have not yet been resolved. Southern blot analysis demonstrates that the increased mRNA levels in these isolates are not the result of gene amplification. Nuclear run-on assays show that MDR1 and CDR mRNAs are transcriptionally overexpressed in the resistant isolate, suggesting that the antifungal drug resistance in this series is associated with the promoter and trans-acting factors of the CDR1, CDR2, and MDR1 genes.


Figures

FIG. 1
FIG. 1
(A) Northern analysis of gene expression during logarithmic growth. Total RNA was prepared from the susceptible and resistant isolates at an initial OD600 of 0.1 and at each doubling time (roughly every 90 min) until the cells reached an OD600 of 3.2. Northern blots of these RNAs were hybridized with gene probes for ERG11, MDR1, CDR1, CDR2, and CDR4 (see Materials and Methods). Each of these blots was simultaneously probed with an oligonucleotide for ACT1. Only the ERG11 actin control is shown here. (B) Relative intensities of gene expression during logarithmic growth. The intensities of mRNA levels from panel A were quantified using a Storm phosphorimager. The intensities were standardized for each RNA in the series using the ACT1 control for each blot. These standardized levels were then normalized to the standardized level of the susceptible isolate at the start of growth, at an OD600 of 0.1. The exceptions were the CDR4 signals, which were not apparent until later in the growth of the culture and which were normalized to the standardized level of the susceptible isolate at an OD600 of 3.2. For each gene, the resistant isolate is represented by filled symbols and the susceptible isolate is represented by open symbols. The relative intensities for each gene are presented on a logarithmic scale with a range of 0.1 to 10 (y axis, labeled on right side of graph).
FIG. 2
FIG. 2
Northern analysis of gene expression in stationary phase. Total RNA was prepared from the susceptible and resistant isolates at a cell concentration of 6.4 OD600 and at 3 and 8 days. Northern blots of these RNAs were hybridized with gene probes for ERG11, MDR1, CDR1, CDR2, and CDR4 (see Materials and Methods). RNAs were loaded so that the visible rRNA bands were approximately equivalent. A control hybridization using housekeeping genes ACT1 or TEF3 was not possible using these RNAs (see Results).
FIG. 3
FIG. 3
Relative intensities of gene expression during growth in different carbon sources. Northern blots were prepared with total RNA from the susceptible and resistant isolates at an OD600 of 1.0 in YEP medium containing glucose (Glu), glycerol (Gly) or acetate (Ace). The blots of these RNAs were hybridized with gene probes for CDR1, CDR2, MDR1, ERG11, and ACT1 (see Materials and Methods). The signals from each blot were quantified using a Storm phosphorimager. The intensities were standardized for each RNA in the series using the corresponding ACT1 signal for the same lane. The standardized levels were then normalized to the standardized level of the resistant isolate grown in glucose, which was assigned a value of 1. For each gene (labeled on the right side of the graph), the resistant isolate is represented by filled symbols and the susceptible isolate is represented by open symbols. The relative intensities for each gene are presented on a linear scale with a range of 0 to 1.2 (y axis, labeled on left side of graph). The lines connecting similar data points are presented for interpretation of the figure, not to imply a temporal or stepwise progression.
FIG. 4
FIG. 4
Southern analysis of gene amplification for CDR1, CDR2, and MDR1. Southern blots were prepared for total genomic DNA from the susceptible (S) and resistant (R) isolates, which were digested with HincII and hybridized with gene-specific probes. Sizes of the hybridizing bands are presented in kilobases. The MDR1 probe recognizes two bands, 2.0 and 1.1 kb, because a HincII restriction site is located near one end of the MDR1 probe. Each blot was also hybridized with ACT1 as a loading control. The MDR1, CDR2, and ACT1 restriction fragments are similar but not identical in size and could easily be distinguished from each other on the blots.
FIG. 5
FIG. 5
Nuclear run-on analysis for the susceptible and resistant isolates. Southern blots were prepared for DNA (10 μg/sample) from within the coding regions of the gene targets ERG11, MDR1, CDR, ACT1, and a DNA plasmid control (see Materials and Methods). The blots were probed with labeled nuclear run-on RNA (see Materials and Methods). Signal intensities of nuclear RNA were quantified using a Storm phosphorimager and standardized to the actin intensities. DNA from a pBluescript SK plasmid was used to control for the nonspecific binding of nuclear RNA to random DNA fragments. The standardized intensities for the susceptible isolate are 0.64, 0.15, 1.38, and 1 for ERG11, MDR1, CDR, and ACT1, respectively. The standardized intensities for the resistant isolate are 0.49, 1.42, 3.64, and 1. The ratio between resistant and susceptible nuclear RNA standardized intensities is given at the bottom of the figure for each gene. Background levels were observed for the DNA controls and for the MDR1 signal from the susceptible isolate. Since the MDR1 signal for the susceptible isolate is indistinguishable from background, the MDR1 ratio is a minimal estimate.
FIG. 6
FIG. 6
Schematic of gene expression during cell growth. The expression patterns of six genes are shown during four different phases of cell growth. The timing of expression is shown horizontally in the figure. S represents gene expression in susceptible cells, R (shaded area) represents gene expression in resistant cells, and S/R represents equivalent expression in both cell types. The height of the arrow is a qualitative representation of the amount of expression at each time point for each gene. Approximate OD600s or length for each phase would be as follows: exponential growth, OD600 of 0.1 to 3.2; diauxic shift, OD600 of approximately 6.4; post-diauxic shift, 3 to 6 days; and stationary phase, 8 days. The format for this figure was adapted from a review of stationary phase growth in S. cerevisiae by Werner-Washburne et al. (34).

References

    1. Baillie G S, Douglas L J. Effect of growth rate on resistance of Candida albicans biofilms to antifungal agents. Antimicrob Agents Chemother. 1998;42:1900–1905. - PMC - PubMed
    1. Balan I, Alarco A M, Raymond M. The Candida albicans CDR3 gene codes for an opaque-phase ABC transporter. J Bacteriol. 1997;179:7210–7218. - PMC - PubMed
    1. Blau J, Xiao H, McCracken S, O'Hare P, Greenblatt J, Bentley D. Three functional classes of transcriptional activation domain. Mol Cell Biol. 1996;16:2044–2055. - PMC - PubMed
    1. Borst P. Genetic mechanisms of drug resistance. A review. Acta Oncol. 1991;30:87–105. - PubMed
    1. Elion E A, Warner J R. An RNA polymerase I enhancer in Saccharomyces cerevisiae. Mol Cell Biol. 1986;6:2089–2097. - PMC - PubMed

Publication types

MeSH terms

Substances

LinkOut - more resources