

Localized proton MR spectroscopy of the allocortex and isocortex in healthy children
- PMID: 10954295
- PMCID: PMC8174910
Localized proton MR spectroscopy of the allocortex and isocortex in healthy children
Abstract
Background and purpose: The human allocortex is different from the isocortex in neuroglial cytoarchitecture. The purpose of this study was to compare metabolic data of the allocortex with those of the isocortex by using localized proton MR spectroscopy.
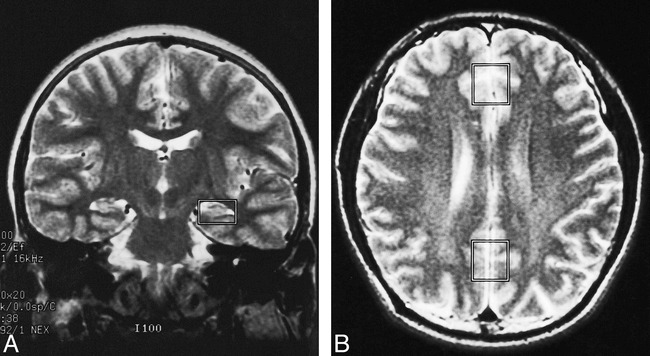
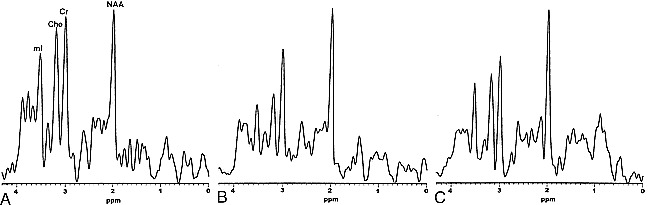
Methods: Short-TE stimulated-echo acquisition mode proton MR spectroscopy (TR/TE = 3000/30) was applied to the allocortex of the temporal lobe and isocortex of the parietal or frontal lobe in 30 healthy children (19 boys and 11 girls, 3-14 years old). Peak intensities of N-acetylaspartate (NAA), choline-containing compounds (Cho), and myo-inositol (mI) relative to creatine and phosphocreatine (Cr) were calculated. Metabolic data from the investigated regions were compared.
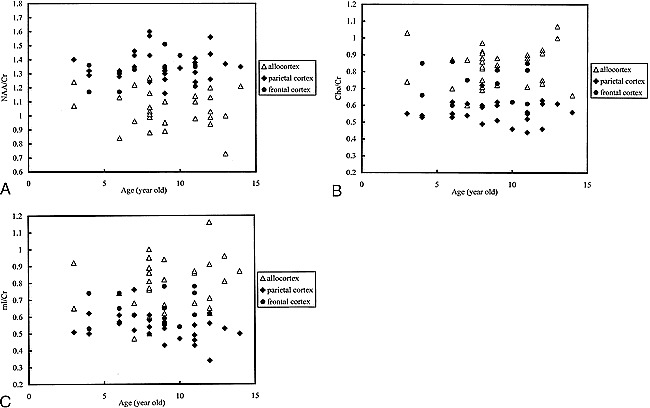
Results: NAA/Cr was significantly lower in the allocortex than in the isocortex of the parietal or frontal lobe: 1.05 +/- 0.12 (n = 33) vs. 1.36 +/- 0.10 (n = 28) or 1.32 +/- 0.10 (n = 12), respectively. Cho/Cr and mI/Cr were significantly higher in the allocortex than in the isocortex: 0.84 +/- 0.11 vs. 0.56 +/- 0.06 or 0.75 +/- 0.10; 0.78 +/- 0.15 vs. 0.54 +/- 0.08 or 0.66 +/- 0.09, respectively. In the isocortex, NAA/Cr was not different but Cho/Cr and mI/Cr were significantly higher in the frontal cortex than in the parietal cortex.
Conclusion: Clear metabolic differences were observed between the allocortex and isocortex.
Figures
Comment in
-
Redefining "normal".AJNR Am J Neuroradiol. 2000 Aug;21(7):1182-3. AJNR Am J Neuroradiol. 2000. PMID: 10954265 Free PMC article. No abstract available.
References
-
- Clemente CD. Developmental and gross anatomy of the central nervous system. In: Clemente CD, ed.Gray's Anatomy, 30th American ed. Philadelphia: Lea & Febiger 1985;1075-1082
-
- Ng TC, Comair YG, Xue M, et al. Temporal lobe epilepsy: presurgical localization with proton chemical shift imaging. Radiology 1994;193:465-472 - PubMed
-
- Lu D, Margouleff C, Rubin E, et al. Temporal lobe epilepsy: correlation of proton magnetic resonance spectroscopy and 18F-fluorodeoxyglucose positron emission tomography. Magn Reson Med 1997;37:18-23 - PubMed
-
- Woermann FG, McLean MA, Bartlett PA, Parker GJ, Duncan JS. Short-echo time single-voxel 1H magnetic resonance spectroscopy in magnetic resonance imaging-negative temporal lobe epilepsy: different biochemical profile compared with hippocampal sclerosis. Ann Neurol 1999;45:369-376 - PubMed
MeSH terms
Substances
LinkOut - more resources
Full Text Sources