. 2000 Sep;74(18):8390-401.
doi: 10.1128/jvi.74.18.8390-8401.2000.

Mutants of human immunodeficiency virus type 1 (HIV-1) reverse transcriptase resistant to nonnucleoside reverse transcriptase inhibitors demonstrate altered rates of RNase H cleavage that correlate with HIV-1 replication fitness in cell culture

Affiliations

Mutants of human immunodeficiency virus type 1 (HIV-1) reverse transcriptase resistant to nonnucleoside reverse transcriptase inhibitors demonstrate altered rates of RNase H cleavage that correlate with HIV-1 replication fitness in cell culture

R H Archer et al. J Virol. 2000 Sep.

Abstract

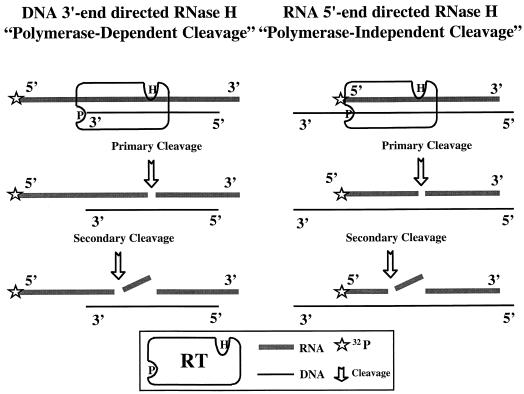
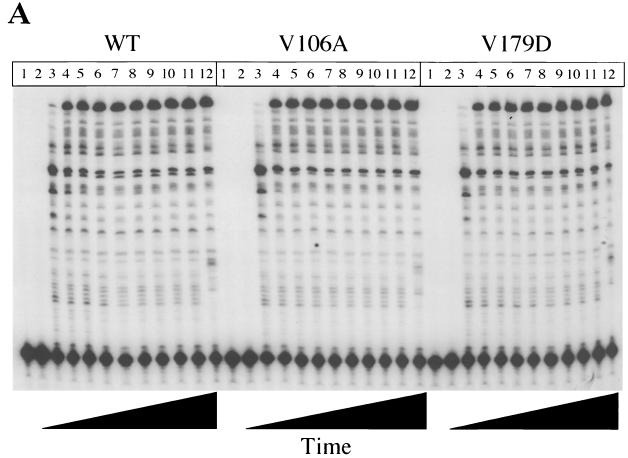
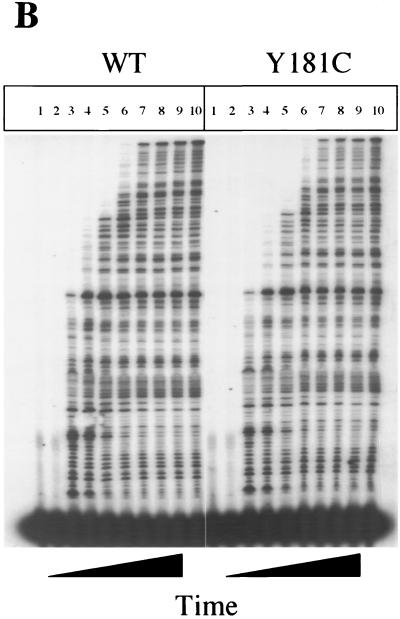
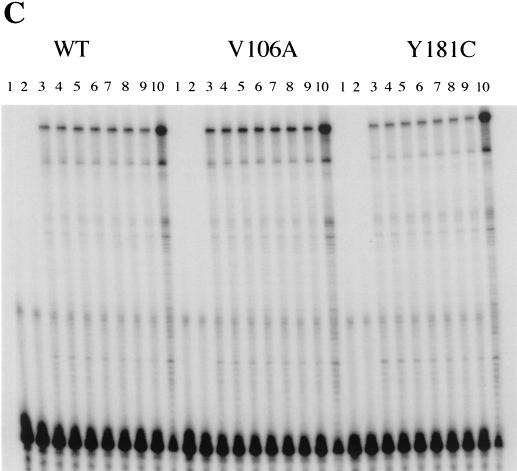
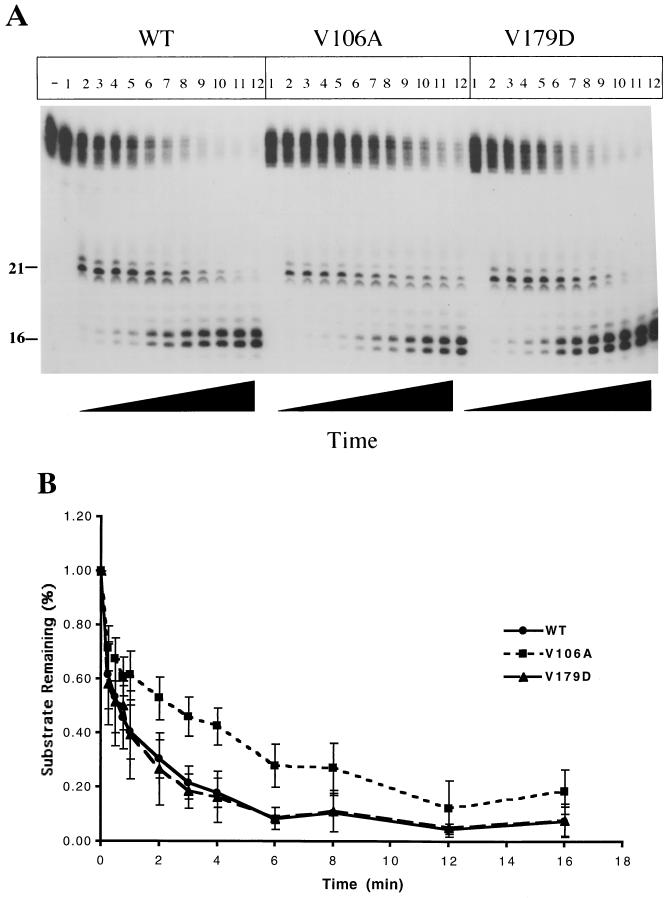
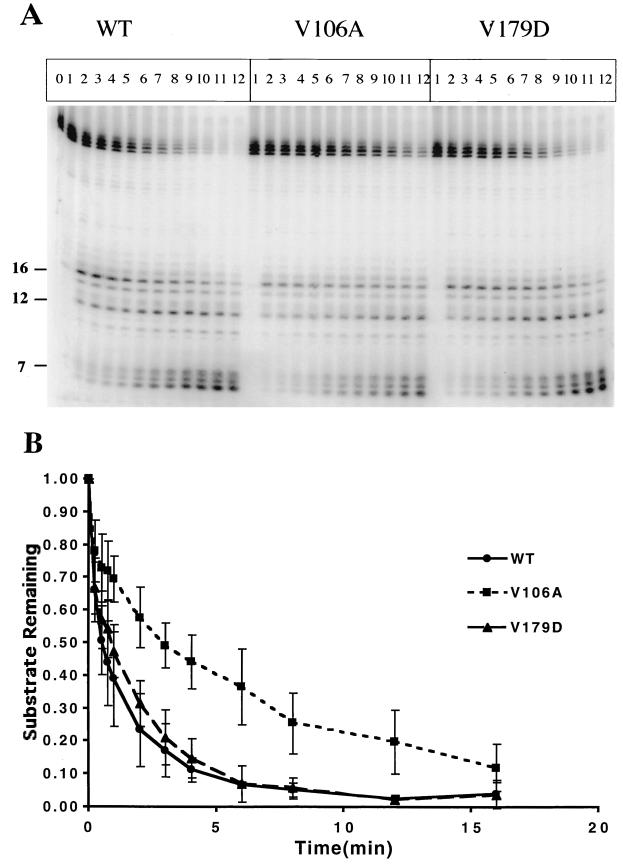
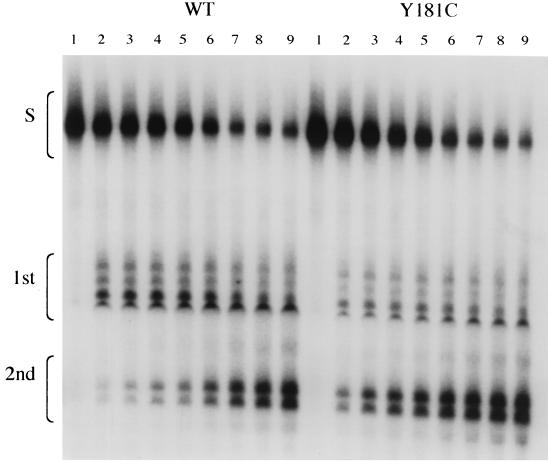
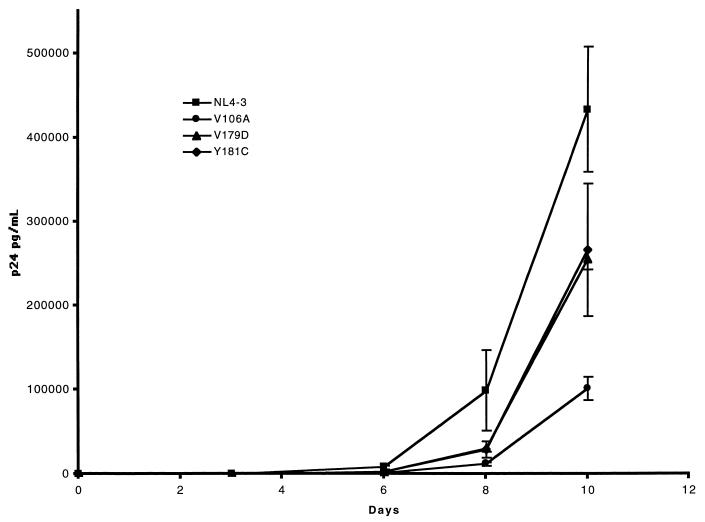
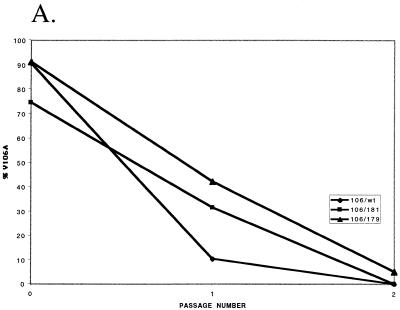
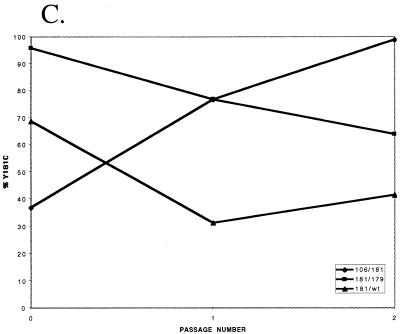
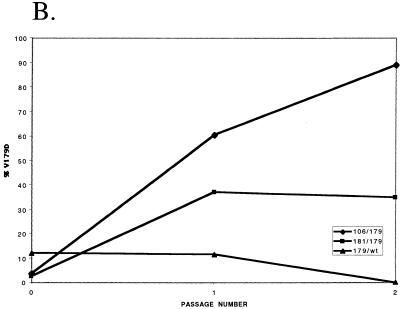
Three mutants of human immunodeficiency virus type 1 (HIV-1) reverse transcriptase (V106A, V179D, and Y181C), which occur in clinical isolates and confer resistance to nonnucleoside reverse transcriptase inhibitors (NNRTIs), were analyzed for RNA- and DNA-dependent DNA polymerization and RNase H cleavage. All mutants demonstrated processivities of polymerization that were indistinguishable from wild-type enzyme under conditions in which deoxynucleoside triphosphates were not limiting. The V106A reverse transcriptase demonstrated a three- to fourfold slowing of both DNA 3'-end-directed and RNA 5'-end-directed RNase H cleavage relative to both wild-type and V179D enzymes, similar to what was observed for P236L in a previously published study (P. Gerondelis et al., J. Virol. 73:5803-5813, 1999). In contrast, the Y181C reverse transcriptase demonstrated a selective acceleration of the secondary RNase H cleavage step during both modes of RNase H cleavage. The relative replication fitness of these mutants in H9 cells was assessed in parallel infections as well as in growth competition experiments. Of the NNRTI-resistant mutants, V179D was more fit than Y181C, and both of these mutants were more fit than V106A, which demonstrated the greatest reduction in RNase H cleavage. These findings, in combination with results from previous work, suggest that abnormalities in RNase H cleavage are a common characteristic of HIV-1 mutants resistant to NNRTIs and that combined reductions in the rates of DNA 3'-end- and RNA 5'-end-directed cleavages are associated with significant reductions in the replication fitness of HIV-1.


Figures

FIG. 1
FIG. 1
Diagram of substrates used to measure DNA 3′-end-directed and RNA 5′-end-directed RNase H cleavage. RNA is represented by a thick line; DNA is represented by a thin line. The stars represent the radiolabeled 5′ end of the RNA. The arrows represent the position at which cleavage of the RNA occurs. The polymerase active site of RT is denoted by a “P,” and the RNase H active site is denoted by an “H.” DNA 3′-end-directed RNase H activity is assayed using a 41-nt 5′-end-radiolabeled RNA hybridized to a complementary DNA such that the 3′ end of the DNA is recessed. Cleavage is monitored by measuring the size of labeled RNA products. RNA 5′-end-directed RNase H activity is assayed using the same 41-nt radiolabeled RNA, hybridized to a long complementary DNA, such that the 5′ end of the RNA is recessed.
FIG. 2
FIG. 2
Processivities of RNA- and DNA-dependent DNA polymerization by NNRTI-resistant mutant RTs. (A) Comparison of wild-type, V106A, and V179D RT processivities on a 142-nt heteropolymeric RNA template. Lanes 1, trap control, in which heparin trap was added along with RT and magnesium; lanes 2, 0 min after addition of magnesium; lanes 3, 15 s; lanes 4, 30 s; lanes 5, 45 s; lanes 6, 1 min; lanes 7, 2 min; lanes 8, 4 min; lanes 9, 8 min; lanes 10, 12 min; lanes 11, 16 min; lanes 12, no trap control, incubated for 16 min. (B) Comparison of wild-type and Y181C RT processivities on a 545-nt heteropolymeric RNA template. Lanes 1, trap control, in which heparin trap was added along with RT and magnesium; lanes 2, 0 min after addition of magnesium; lanes 3, 15 s; lanes 4, 30 s; lanes 5, 1 min; lanes 6, 2 min; lanes 7, 4 min; lanes 8, 8 min; lanes 9, 16 min; lanes 10, no trap control incubated for 16 min. (C) Comparison of wild-type, V106A, and Y181C RT processivities on a 105-nt heteropolymeric DNA template. Lanes 1, trap control, in which heparin trap was added along with RT and magnesium; lanes 2, 0 min after addition of magnesium; lanes 3, 15 s; lanes 4, 30 s; lanes 5, 1 min; lanes 6, 2 min; lanes 7, 4 min; lanes 8, 8 min; lanes 9, 16 min; lanes 10, no trap control incubated for 16 min.
FIG. 2
FIG. 2
Processivities of RNA- and DNA-dependent DNA polymerization by NNRTI-resistant mutant RTs. (A) Comparison of wild-type, V106A, and V179D RT processivities on a 142-nt heteropolymeric RNA template. Lanes 1, trap control, in which heparin trap was added along with RT and magnesium; lanes 2, 0 min after addition of magnesium; lanes 3, 15 s; lanes 4, 30 s; lanes 5, 45 s; lanes 6, 1 min; lanes 7, 2 min; lanes 8, 4 min; lanes 9, 8 min; lanes 10, 12 min; lanes 11, 16 min; lanes 12, no trap control, incubated for 16 min. (B) Comparison of wild-type and Y181C RT processivities on a 545-nt heteropolymeric RNA template. Lanes 1, trap control, in which heparin trap was added along with RT and magnesium; lanes 2, 0 min after addition of magnesium; lanes 3, 15 s; lanes 4, 30 s; lanes 5, 1 min; lanes 6, 2 min; lanes 7, 4 min; lanes 8, 8 min; lanes 9, 16 min; lanes 10, no trap control incubated for 16 min. (C) Comparison of wild-type, V106A, and Y181C RT processivities on a 105-nt heteropolymeric DNA template. Lanes 1, trap control, in which heparin trap was added along with RT and magnesium; lanes 2, 0 min after addition of magnesium; lanes 3, 15 s; lanes 4, 30 s; lanes 5, 1 min; lanes 6, 2 min; lanes 7, 4 min; lanes 8, 8 min; lanes 9, 16 min; lanes 10, no trap control incubated for 16 min.
FIG. 3
FIG. 3
DNA 3′-end-directed RNase H activity of wild-type, V106A, and V179D RTs. (A) Autoradiogram of a representative experiment. Lane “−,” no RT control. Lanes 1, 0 min; lanes 2, 15 s; lanes 3, 30 s; lanes 4, 45 s; lanes 5, 1 min; lanes 6, 2 min; lanes 7, 3 min; lanes 8, 4 min; lanes 9, 6 min; lanes 10, 8 min; lanes 11, 12 min; lanes 12, 16 min. Numbers to the left of the autoradiogram represent the length in nucleotides. Bands of approximately 21 nt represent primary cleavage products (13 nt from the recessed DNA 3′ end), and bands of approximately 16 nt represent secondary cleavage products (8 nt from the recessed DNA 3′ end). (B) DNA 3′-end-labeled RNase H cleavage. A graph of the quantitation data, obtained by using phosphorimaging, is shown. Datum points are means of five independent experiments; vertical bars represent standard deviations. The vertical axis represents the fraction of substrate remaining relative to time zero.
FIG. 4
FIG. 4
RNA 5′-end-directed RNase H activity of wild-type, V106A, and V179D RTs. (A) Autoradiogram of a representative experiment. Assays were performed as described in Materials and Methods. Lane −, control in which RT was not added; lanes 1, 0 min; lanes 2, 15 s; lanes 3, 30 s; lanes 4, 45 s; lanes 5, 1 min; lanes 6, 2 min; lanes 7, 3 min; lanes 8, 4 min; lanes 9, 6 min; lanes 10, 8 min; lanes 11, 12 min; lanes 12, 16 min. Numbers to the left of the autoradiogram represent the length in nucleotides. Bands migrating at a position approximately 16 nt from the 5′ end represent primary cleavage products, and bands migrating at a position approximately 7 nt from the 5′ end represent secondary cleavage products. (B) RNA 5′-end-directed RNase H activity. A graph of the quantitation data for substrate degradation, obtained by using phosphorimaging, is shown. Datum points are means of four independent experiments; vertical bars represent standard deviations. The vertical axis represents the fraction of substrate remaining, relative to time zero.
FIG. 5
FIG. 5
RNA 5′-end-directed RNase H activity of wild-type and Y181C RTs. Autoradiogram of a representative experiment. Lanes 1, 0 min; lanes 2, 15 s; lanes 3, 30 s; lanes 4, 45 s; lanes 5, 1 min; lanes 6, 2 min; lanes 7, 4 min; lanes 8, 8 min; lanes 9, 16 min. Brackets denote substrate (S), first cleavage products (1st), and second cleavage products (2nd).
FIG. 6
FIG. 6
Replication kinetics of NNRTI-resistant mutants. Separate cultures of H9 cells were infected with HIVNL43 (■), HIVNL43/V106A (●), HIVNL43/V179D (▴), and HIVNL43/Y181C (⧫), as described in Materials and Methods. Viral replication was monitored over a period of 10 days by measuring HIV-1 p24 antigen concentration. Error bars show the standard deviation of the mean p24 antigen concentration from three independent infections.
FIG. 7
FIG. 7
Replication competition experiments of combinations of wild-type and NNRTI-resistant mutants of NL4-3. H9 cells were infected with two different mutant (or with mutant and wild-type) stocks at time zero at an MOI of 0.005 for each stock. At the end of each passage (7 days), 10 μl of culture supernatant was used to infected a fresh culture of H9 cells. Cells were harvested at the time of infection and at the end of each passage, and proviral DNA was PCR amplified and directly sequenced to determine the relative proportion of the V106A (A), V179D (B), and Y181C (C) mutants. Each datum point represents the proportion of a mutant, as determined by averaging results obtained with sense and antisense primers from at least two independent infections.
FIG. 7
FIG. 7
Replication competition experiments of combinations of wild-type and NNRTI-resistant mutants of NL4-3. H9 cells were infected with two different mutant (or with mutant and wild-type) stocks at time zero at an MOI of 0.005 for each stock. At the end of each passage (7 days), 10 μl of culture supernatant was used to infected a fresh culture of H9 cells. Cells were harvested at the time of infection and at the end of each passage, and proviral DNA was PCR amplified and directly sequenced to determine the relative proportion of the V106A (A), V179D (B), and Y181C (C) mutants. Each datum point represents the proportion of a mutant, as determined by averaging results obtained with sense and antisense primers from at least two independent infections.

References

    1. Amacker M, Hubscher U. Chimeric HIV-1 and feline immunodeficiency virus reverse transcriptases: critical role of the p51 subunit in the structural integrity of heterodimeric lentiviral DNA polymerases. J Mol Biol. 1998;278:757–765. - PubMed
    1. Arion D, Kaushik N, McCormick S, Borkow G, Parniak M A. Phenotypic mechanism of HIV-1 resistance to 3′-azido-3′-deoxythymidine (AZT): increased polymerization processivity and enhanced sensitivity to pyrophosphate of the mutant viral reverse transcriptase. Biochemistry. 1998;37:15908–15917. - PubMed
    1. Arts E J, Le Grice S F. Interaction of retroviral reverse transcriptase with template-primer duplexes during replication. Prog Nucleic Acid Res Mol Biol. 1998;58:339–393. - PubMed
    1. Back N K, Berkhout B. Limiting deoxynucleoside triphosphate concentrations emphasize the processivity defect of lamivudine-resistant variants of human immunodeficiency virus type 1 reverse transcriptase. Antimicrob Agents Chemother. 1997;41:2484–2491. - PMC - PubMed
    1. Back N K, Nijhuis M, Keulen W, Boucher C A, Oude Essink B O, van Kuilenburg A B, van Gennip A H, Berkhout B. Reduced replication of 3TC-resistant HIV-1 variants in primary cells due to a processivity defect of the reverse transcriptase enzyme. EMBO J. 1996;15:4040–4049. - PMC - PubMed

Publication types

MeSH terms

Substances

LinkOut - more resources