. 2000 Sep;74(18):8413-24.
doi: 10.1128/jvi.74.18.8413-8424.2000.

Differential dynamics of CD4(+) and CD8(+) T-lymphocyte proliferation and activation in acute simian immunodeficiency virus infection

Affiliations

Differential dynamics of CD4(+) and CD8(+) T-lymphocyte proliferation and activation in acute simian immunodeficiency virus infection

A Kaur et al. J Virol. 2000 Sep.

Abstract

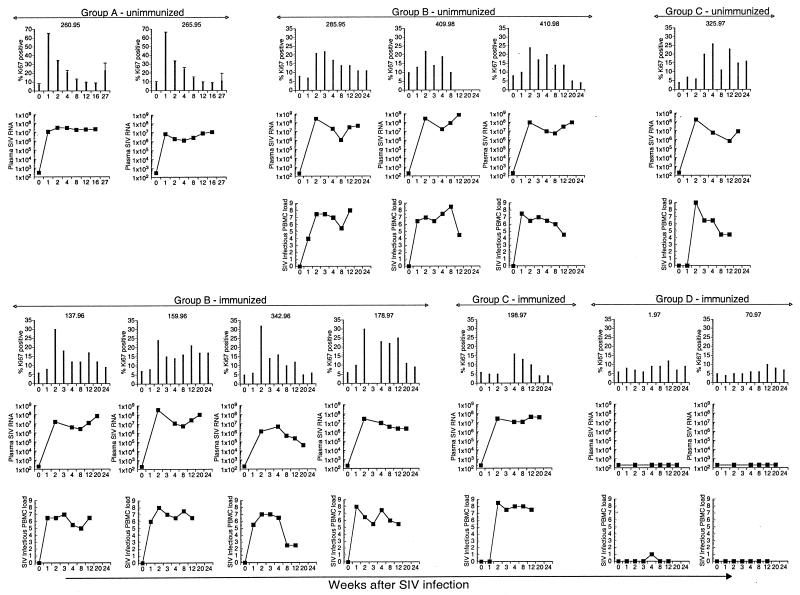
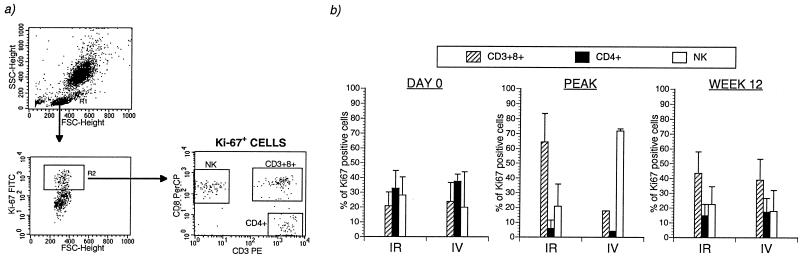
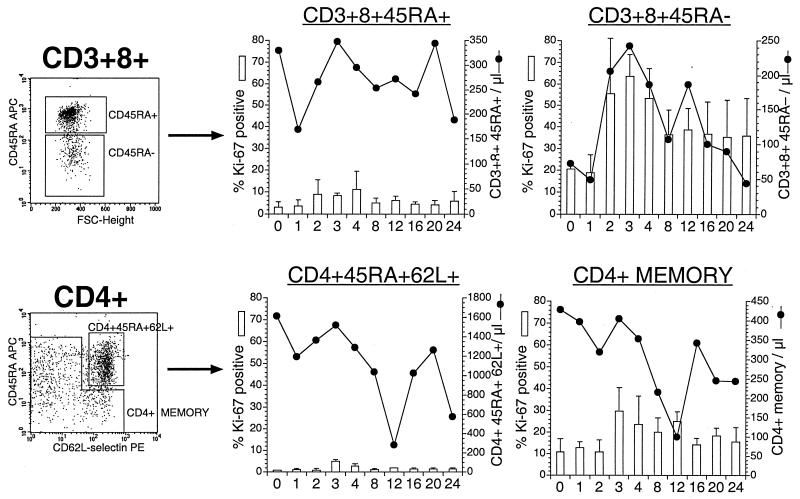
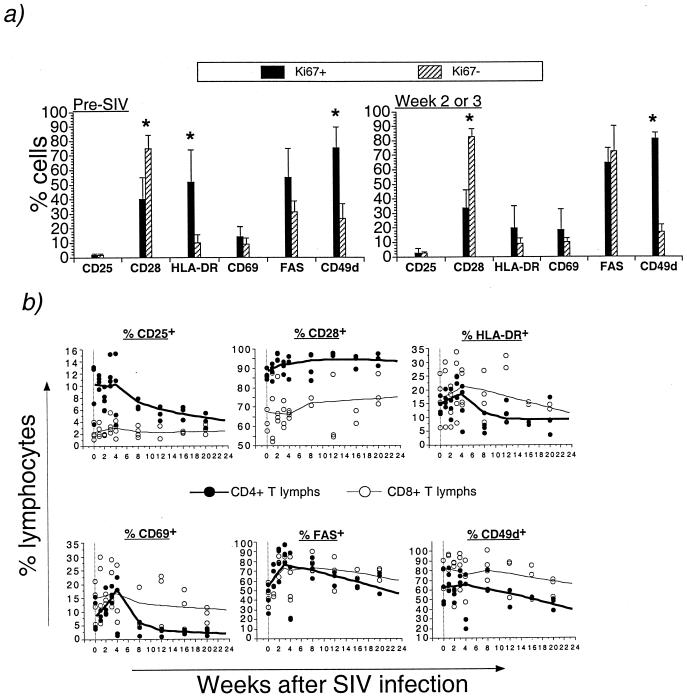
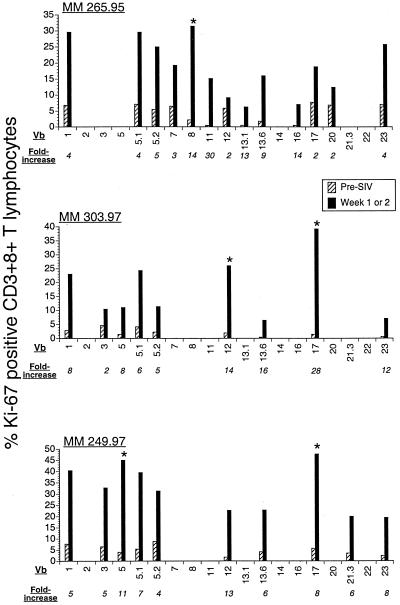
Although lymphocyte turnover in chronic human immunodeficiency virus and simian immunodeficiency virus (SIV) infection has been extensively studied, there is little information on turnover in acute infection. We carried out a prospective kinetic analysis of lymphocyte proliferation in 13 rhesus macaques inoculated with pathogenic SIV. A short-lived dramatic increase in circulating Ki-67(+) lymphocytes observed at 1 to 4 weeks was temporally related to the onset of SIV replication. A 5- to 10-fold increase in Ki-67(+) CD8(+) T lymphocytes and a 2- to 3-fold increase in Ki-67(+) CD3(-) CD8(+) natural killer cells accounted for >85% of proliferating lymphocytes at peak proliferation. In contrast, there was little change in the percentage of Ki-67(+) CD4(+) T lymphocytes during acute infection, although transient increases in Ki-67(-) and Ki-67(+) CD4(+) T lymphocytes expressing CD69, Fas, and HLA-DR were observed. A two- to fourfold decline in CD4(+) T lymphocytes expressing CD25 and CD69 was seen later in SIV infection. The majority of Ki-67(+) CD8(+) T lymphocytes were phenotypically CD45RA(-) CD49d(hi) Fas(hi) CD25(-) CD69(-) CD28(-) HLA-DR(-) and persisted at levels twofold above baseline 6 months after SIV infection. Increased CD8(+) T-lymphocyte proliferation was associated with cell expansion, paralleled the onset of SIV-specific cytotoxic T-lymphocyte activity, and had an oligoclonal component. Thus, divergent patterns of proliferation and activation are exhibited by CD4(+) and CD8(+) T lymphocytes in early SIV infection and may determine how these cells are differentially affected in AIDS.


Figures

FIG. 1
FIG. 1
Longitudinal analysis of lymphocyte proliferation, plasma SIV RNA, and infectious SIV load in PBMC in individual rhesus macaques inoculated with pathogenic SIV. Data for seven animals immunized with an HSV recombinant expressing SIV proteins prior to SIV inoculation are shown in the bottom half of the figure. Data for six animals that were SIV naive prior to SIV inoculation (includes one animal, 285.95, that received a control HSV recombinant) are shown in the top panel. The animals were grouped on the basis of time of appearance of peak increase in Ki-67 expression in total lymphocytes in peripheral blood following SIV inoculation. This occurred at 1 week in group A, at 2 weeks in group B, and at 4 weeks after SIV inoculation in group C animals. In group D animals, there was no change in Ki-67 expression following SIV inoculation. Infectious SIV loads in PBMC were not available for the two group A animals.
FIG. 2
FIG. 2
Kinetics of plasma SIV viremia and its relationship to lymphocyte proliferation after acute SIV infection. Animals were grouped on the basis of time of appearance of peak increase in Ki-67+ lymphocytes after SIV infection. Means and standard errors for percentages of Ki-67+ lymphocytes (bars) and mean values for infectious SIV load in PBMC (14) and plasma SIV RNA (35) (lines) are shown. Viral load data for groups B to D are from Murphy et al. (26a).
FIG. 3
FIG. 3
CD8+ T lymphocytes and NK cells are the dominant proliferating cells in acute SIV infection. (a) A representative plot from one rhesus macaque 2 weeks after SIV infection. Individual cell subsets within the small-lymphocyte gate were analyzed for intracellular Ki-67 antigen as shown. The small-lymphocyte gate included >91% of all lymphocytes. The definition of CD4+ T lymphocytes as CD3+ CD8 was validated by concurrent three-color phenotyping with MAb to CD3, CD4, and CD8 (data not shown). FSC, forward scatter; SSC, side scatter. (b) Longitudinal analysis of fractions of Ki-67 antigen-positive cells in different lymphocyte subsets in 13 rhesus macaques after SIV infection. Mean and standard error for the fraction of Ki-67+ cells in each lymphocyte subset are shown.
FIG. 4
FIG. 4
Composition of the total pool of Ki-67+ cells in peripheral blood before and after pathogenic SIV infection. (a) A representative plot illustrating analysis of Ki-67+ cells. FSC, forward scatter; SSC, side scatter. (b) Composition of Ki-67+ cells during SIV infection in two macaques inoculated intravenously (IV) with SIVmac251 and in nine macaques inoculated intrarectally (IR) with SIVmac239. Peak refers to the time of maximal expression of Ki-67 after SIV infection. The two group D animals are excluded from analysis.
FIG. 5
FIG. 5
Differing kinetics of proliferation for CD4+ and CD8+ T lymphocytes in acute SIV infection. kp is the proliferation rate calculated by the formula kp = fKi67/T, and d refers to the net disappearance rate calculated with the formula d = (kdns)/n = [kpn − (dn/dt)]/n.
FIG. 6
FIG. 6
Relationship between proliferating CD4+ and CD8+ T lymphocytes and cell counts in the first 4 weeks after SIV infection. Plots of linear-regression analysis are shown. The dotted lines depict 95% confidence bands for means. P values were generated by the software Statview, using analysis of variance.
FIG. 7
FIG. 7
Longitudinal analysis of proliferation of naive and memory CD4+ and CD8+ T lymphocytes after SIV infection. Representative plots with delineation of naive and memory CD4+ and CD8+ T lymphocytes are shown. CD45RA was used to designate CD3+ CD8+ T lymphocytes as having a naive (CD45RA+) or memory (CD45RA) phenotype. CD45RA and CD62L-selectin were used to delineate naive and memory CD4+ T lymphocytes. The fractions of Ki-67+ naive and memory CD4+ and CD8+ T lymphocytes (shown as columns) and their absolute cell counts (shown as lines) at corresponding times after SIV infection are depicted. Data are means of values from four animals. Error bars indicate the standard error for percent Ki-67 expression. FSC, forward scatter.
FIG. 8
FIG. 8
Longitudinal phenotypic analysis of T lymphocytes in acute SIV infection. (a) Differential expression of activation and costimulatory molecules on Ki-67+ and Ki-67 CD8+ T lymphocytes prior to and after SIV infection. Asterisks indicate a statistically significant difference between Ki-67+ and Ki-67 cells for that surface marker (Mann-Whitney U test). (b) Bivariate scattergram plots and Lowess lines of data from four rhesus macaques showing changes in the fraction of CD4+ and CD8+ T lymphocytes (lymphs) expressing the indicated molecules in the first 6 months after intrarectal SIVmac239 inoculation. One rhesus macaque died of AIDS 10 weeks after SIV infection.
FIG. 9
FIG. 9
Oligoclonal proliferation of CD8+ T lymphocytes in acute SIV infection. Proliferating fractions of 19 TCR Vβ (Vb) subsets were determined by flow cytometry before and at the peak of proliferation after SIV infection in three rhesus macaques. Asterisks denote Vβ subsets with >25% proliferating fraction and a more than eightfold increase in proliferation following SIV infection. MM, Macacamulatta.

References

    1. Anonymous. Guide for the care and use of laboratory animals. Washington, D.C.: The Institute of Laboratory Animal Resources, National Research Council; 1996. pp. 86–123.
    1. Bruno S, Darzynkiewicz Z. Cell cycle dependent expression and stability of the nuclear protein detected by Ki-67 antibody in HL-60 cells. Cell Prolif. 1992;25:31–40. - PubMed
    1. Butz E A, Bevan M J. Massive expansion of antigen-specific CD8+ T cells during an acute virus infection. Immunity. 1998;8:167–175. - PMC - PubMed
    1. Callan M F, Steven N, Krausa P, Wilson J D, Moss P A, Gillespie G M, Bell J I, Rickinson A B, McMichael A J. Large clonal expansions of CD8+ T cells in acute infectious mononucleosis. Nat Med. 1996;2:906–911. - PubMed
    1. Callan M F, Tan L, Annels N, Ogg G S, Wilson J D, O'Callaghan C A, Steven N, McMichael A J, Rickinson A B. Direct visualization of antigen-specific CD8+ T cells during the primary immune response to Epstein-Barr virus in vivo. J Exp Med. 1998;187:1395–1402. - PMC - PubMed

Publication types

MeSH terms