. 2000 Oct;67(4):947-59.
doi: 10.1086/303069. Epub 2000 Aug 22.

Accuracy of haplotype frequency estimation for biallelic loci, via the expectation-maximization algorithm for unphased diploid genotype data

Affiliations

Accuracy of haplotype frequency estimation for biallelic loci, via the expectation-maximization algorithm for unphased diploid genotype data

D Fallin et al. Am J Hum Genet. 2000 Oct.

Abstract

Haplotype analyses have become increasingly common in genetic studies of human disease because of their ability to identify unique chromosomal segments likely to harbor disease-predisposing genes. The study of haplotypes is also used to investigate many population processes, such as migration and immigration rates, linkage-disequilibrium strength, and the relatedness of populations. Unfortunately, many haplotype-analysis methods require phase information that can be difficult to obtain from samples of nonhaploid species. There are, however, strategies for estimating haplotype frequencies from unphased diploid genotype data collected on a sample of individuals that make use of the expectation-maximization (EM) algorithm to overcome the missing phase information. The accuracy of such strategies, compared with other phase-determination methods, must be assessed before their use can be advocated. In this study, we consider and explore sources of error between EM-derived haplotype frequency estimates and their population parameters, noting that much of this error is due to sampling error, which is inherent in all studies, even when phase can be determined. In light of this, we focus on the additional error between haplotype frequencies within a sample data set and EM-derived haplotype frequency estimates incurred by the estimation procedure. We assess the accuracy of haplotype frequency estimation as a function of a number of factors, including sample size, number of loci studied, allele frequencies, and locus-specific allelic departures from Hardy-Weinberg and linkage equilibrium. We point out the relative impacts of sampling error and estimation error, calling attention to the pronounced accuracy of EM estimates once sampling error has been accounted for. We also suggest that many factors that may influence accuracy can be assessed empirically within a data set-a fact that can be used to create "diagnostics" that a user can turn to for assessing potential inaccuracies in estimation.


Figures

Figure  1
Figure 1
Conceptual framework for simulation studies and accuracy comparisons.
Figure  2
Figure 2
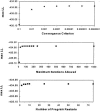
Distribution of maximum log-likelihoods from the estimation procedure, by program settings: convergence criterion, maximum iterations, and number of restarts at different random initial-frequency values. For these analyses, 500 data sets of 200 individuals each were simulated for a five-locus system (mean frequency .03125; variance 10.0). The analyses for each panel were performed on the same batch of 500 simulated sets each time, with the parameter of interest progressively adjusted to a more stringent value (the standard error of the maximum log-likelihood values for all situations was .098).
Figure  3
Figure 3
Influence of sample size on haplotype frequency estimates. A and B, Haplotype frequencies at the three steps of the simulation procedure. Generating frequencies (Gk [line]), sample frequencies (Sk [triangles]), and resulting haplotype frequency estimates from the EM algorithm (Ek [unblackened circles]) for a five-locus system with equally frequent population haplotype frequencies, with sample size set to N=50 (A) and N=500 (B) are shown. C, Average MSE and 95% CI for batches of 500 data sets of each sample size for five-locus haplotypes generated under the N(1/k2) model. Unbroken line denotes comparisons of EM estimates to sample values (SE); dotted line, EM estimates to generating parameters (GE).
Figure  4
Figure 4
MSE of the final estimates as a function of the amount of missing phase information per data set. The X-axis indicates the proportion of heterozygous loci in the entire data set as a measure of the overall missing phase information in the sample. MSEs for the SE (unbroken line) and GE (dotted line) comparisons are plotted along the Y-axis. A, Data sets with generating haplotypes drawn for the normal distribution scenario. B, Data sets with generating haplotype frequencies drawn from a Dirichlet distribution with one haplotype parameter set at 50 and the rest set equal and with Hardy-Weinberg disequilibrium among the haplotypes set to .05. Both panels are based on 10,000 simulated sets (size 200 individuals), for a five-locus system with 15 restarts, 150 maximum iterations, and convergence set to 10−5.
Figure  5
Figure 5
Accuracy of program estimates by haplotype frequency distributions within data sets. MSE measures for the SE (unbroken line) and GE (dotted line) comparisons are plotted along the Y-axis. In panels A–C, the X-axis indicates the frequency of the most common estimated haplotype per data set. In panels D–F, the X-axis indicates the frequency of the least common (nonzero) estimated haplotype per data set. A and B, Batches of data sets simulated under the normal generating distribution scenario. C and D, Generating haplotype frequency parameter values drawn from a Dirichlet distribution with equal parameters. E and F, Generating haplotype frequency parameter values drawn from a Dirichlet distribution with one extreme parameter value (∼90%). Each panel is based on 10,000 simulated sets (size 200 individuals), for a five-locus system with 15 restarts, 150 maximum iterations, and convergence set to 10−5.
Figure  6
Figure 6
Accuracy of program estimates as a function of the dispersion of haplotype frequency values within a data set. MSE measures for the SE (solid line) and GE (dotted line) comparisons are plotted along the Y-axis. In panel A, the X-axis represents the variance used to derive generating haplotype frequency values under the normal distribution scenario. A total of 500 data sets were simulated for each variance value. In panels B and C, the X-axis represents the χ2 value for a test of equality of haplotype frequency values within each data set. These panels represent batches from simulations under the Dirichlet distribution with either uniform parameters (B) or one extreme parameter (C). Both panels are based on 10,000 simulated data sets. All simulations were done for samples of 200 individuals, for a five-locus system with 15 restarts, 150 maximum iterations, and convergence set to 10−5.
Figure  7
Figure 7
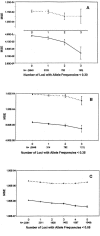
Accuracy of program estimates by number of constituent loci with “rare” allele frequencies per data set. MSE measures for the SE (unbroken line) and GE (dotted line) comparisons are plotted along the Y-axis. A, Batch simulated under the normal generating distribution scenario. MSEse and MSEge have separate axes because of orders of scale. B, Generating haplotype frequency parameter values drawn from a Dirichlet distribution with equal parameters. C, Generating haplotype frequency parameter values drawn from a Dirichlet distribution with one extreme parameter value (∼90%). Each panel is based on 10,000 simulated sets (size 200 individuals), for a five-locus system with 15 restarts, 150 maximum iterations, and convergence set to 10−5.
Figure  8
Figure 8
Accuracy of program estimates of HWD. The Y-axis indicates MSE between final haplotype frequency estimates and sample-set values (unbroken line) or generating population parameter values (dotted line). Each panel is based on 10,000 simulated sets under the extreme Dirichlet generating frequency model with HWD (either toward heterozygosity, [A and C] or homozygosity [B and D]) introduced at the haplotype level during the sampling process. Aand B, MSE by the number of loci per simulation with significant HWD. C and D, MSEse as a function of the most extreme HWD coefficient across loci per simulation. All simulations were done for 200 individuals, for a five-locus system with 15 restarts, 150 maximum iterations, and convergence set to 10−5.
Figure  9
Figure 9
Accuracy of program estimates by LD. The Y-axis indicates MSE between final haplotype frequency estimates and sample-set values (unbroken line) or generating population parameter values (dotted line). The X-axis indicates the average D′ LD value across all pairwise comparisons per simulation. A, Simulations generated under the normal distribution scenario. B, Population haplotype frequency values drawn from a Dirichlet distribution with equal parameters. C, Population haplotype frequency values drawn from a Dirichlet distribution with one extreme parameter value (∼50%) and HWD induced toward homozygosity. Each panel is based on 10,000 simulated sets (size 200 individuals), for a five-locus system with 15 restarts, 150 maximum iterations, and convergence set to 10−5.
Figure  10
Figure 10
Accuracy of program estimates by number of loci in haplotype. The Y-axis indicates MSE between final haplotype frequency estimates and sample-set values (unbroken line) or generating population parameter values (dotted line). The categories represented on the X-axis correspond to 1,000 simulations each (2-, 3-, 4-, 5-, 7-, and 10-locus systems). All simulations were for 200 individuals, with 15 restarts, 150 maximum iterations, and convergence set to 10−5.

References

    1. Clark A (1990) Inference of haplotypes from PCR-amplified samples of diploid populations. Mol Biol Evol 7:111–122 - PubMed
    1. Excoffier L, Slatkin M (1995) Maximum-likelihood estimation of molecular haplotype frequencies in a diploid population. Mol Biol Evol 12:921–927 - PubMed
    1. Hawley M, Kidd K (1995) HAPLO: a program using the EM algorithm to estimate the frequencies of multi-site haplotypes. J Hered 86:409–411 - PubMed
    1. Lewontin RC (1964) The interaction of selection and linkage. I. General considerations: heterotic models. Genetics 49:49–67 - PMC - PubMed
    1. Long J, Williams R, Urbanek M (1995) An E-M algorithm and testing strategy for multiple-locus haplotypes. Am J Hum Genet 56:799–810 - PMC - PubMed

Publication types

LinkOut - more resources