Comparative Study
. 2000 Aug;10(8):1126-37.
doi: 10.1101/gr.10.8.1126.

Genome-wide detection of allelic imbalance using human SNPs and high-density DNA arrays

Affiliations
Comparative Study

Genome-wide detection of allelic imbalance using human SNPs and high-density DNA arrays

R Mei et al. Genome Res. 2000 Aug.

Abstract

Most human cancers are characterized by genomic instability, the accumulation of multiple genetic alterations and allelic imbalance throughout the genome. Loss of heterozygosity (LOH) is a common form of allelic imbalance and the detection of LOH has been used to identify genomic regions that harbor tumor suppressor genes and to characterize tumor stages and progression. Here we describe the use of high-density oligonucleotide arrays for genome-wide scans for LOH and allelic imbalance in human tumors. The arrays contain redundant sets of probes for 600 genetic loci that are distributed across all human chromosomes. The arrays were used to detect allelic imbalance in two types of human tumors, and a subset of the results was confirmed using conventional gel-based methods. We also tested the ability to study heterogeneous cell populations and found that allelic imbalance can be detected in the presence of a substantial background of normal cells. The detection of LOH and other chromosomal changes using large numbers of single nucleotide polymorphism (SNP) markers should enable identification of patterns of allelic imbalance with potential prognostic and diagnostic utility.


Figures

Figure 1
Figure 1
SNP array design. (A) Design for querying a locus. Target sequences (lowercase) for both A and B alleles are identical except for the polymorphic base (uppercase). Five positions at or near the polymorphic locus, indicated by −4, −1, 0, +1 and +4, are queried. (Solid line) Probe sequences on the SNP array that are complementary to the targets; (squares) set of four probes (each probe 20 bases in length), referred to as a tiling, identical except for the single base that is either A, C, G, or T; (closed squares) perfect match (PM) probes for the target sample; (open squares) mismatch (MM) probes for the target sample. (B) Block design for genotyping of two alleles. The A-allele (A) and B-allele (B) probes are arranged adjacent to each other at each position (−4, −1, 0, +1 and +4). The A- and B-allele tiles at position −1, −4, +1, or +4 define a miniblock, whereas for the polymorphic base (position 0) the single tile defines a miniblock. One strand of a marker is represented by these five miniblocks, defining a block.
Figure 2
Figure 2
Fluorescence images of the SNP array following hybridization of a tumor sample. (A) Low magnification view of the entire fluorescence hybridization image of the SNP array, (B) an enlarged portion of the hybridization pattern, and (C) block images for three genotypes (AA homozygous, AB heterozygous, and BB homozygous). For each block, the probes at the top left and right corners are control probes, complementary to a labeled control oligonucleotide added to every sample. For heterozygous loci, perfect matches for both alleles have significant fluorescence signal (white) at every position, whereas for homozygous loci, only perfect matches for one allele yield significant signal.
Figure 3
Figure 3
The hybridization patterns for a SNP marker on chromosome 22. One parent is heterozygous (AB) and the other is homozygous (BB) at this marker. The child is heterozygous (AB) using DNA derived from blood, but scored as homozygous (BB) for the same locus using DNA derived from two independent tumors.
Figure 4
Figure 4
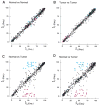
Reproducibility of the SNP array-based analysis. Loci were independently amplified and labeled three times from a pair of normal and aneuploid DNA samples. The paired samples generated by the three independent preparations were hybridized to six SNP arrays. The sample amplification, labeling, and hybridization procedures and conditions are as described in Methods. (A) Linear correlation plot for normal replicates. [N (Exp1) and N (Exp2)] Calculated values for normal samples in experiments 1 and 2, respectively. (B) Linear correlation plot for tumor (aneuploid) replicates. [T (Exp1) and T (Exp2)] Calculated values for aneuploid samples in experiments 1 and 2, respectively. (C,D) Correlation between the normal and the aneuploid samples for experiment 1 and 2, respectively. (Blue and red circles) Loci scored as allelic imbalance events in both replicates. In the normal samples, the values for these loci were within the heterozygous range (75 ≥ ≥ 25), whereas in the aneuploid samples, the same loci were within the homozygous range [≤ 25 (red circles, homozygous BB) or ≥ 75 (blue circles, homozygous AA)]. (Black solid dots) Non-informative loci (≤ 25 or ≥ 75 in the normal) or heterozygous loci with no allelic imbalance.
Figure 5
Figure 5
Genome-wide representation of the SNP-based analysis. (A) Genome-wide allelic imbalance detection using SNP markers in the same esophageal adenocarcinoma aneuploid population from the reproducibility experiment (Fig. 4). Of 558 SNP markers 470 passed the quality analysis and 150 of the 470 markers were informative for this individual. Chromosomal regions with SNPs showing a |Δ| ≥ 20 were independently checked with STRs that lie within the SNP region or flank the SNP loci. The |Δ| values for all loci including non-informative SNPs are shown. (B) Genome-wide difference detection in NF-2 tumors. For this experiment, an older version of the SNP arrays containing 250 SNPs was used, with 167 of the 250 SNPs passing the quality analysis and 63 of the 167 markers being informative. The distance between tick marks on the x-axis is defined by the number of SNPs on each chromosome (based on the Whitehead Institute SNP map). The values on the y-axis are the difference in |Δ| values between normal and tumor samples. The dashed line indicates the threshold value (|Δ| ≥ 20), as described in the Data Analysis section.
Figure 6
Figure 6
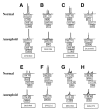
Representative examples of LOH assessed by gel-based STR analysis. Shown are examples of loss (in the aneuploid populations) of the shorter allele of tetranucleotide repeats (A–C), loss of the longer allele (D–F) and loss with dinucleotides repeats (G,H). For each allele, the repeat lengths and peak heights (fluorescent units) are shown, and the locus name is given below each normal/aneuploid pair. Allelic imbalance was measured by fluorescence intensity of the shorter allele A relative to that of the longer allele B; (A/B) in the aneuploid sample, relative to a normal constitutive control. Ratios <0.4 or >2.5 (depending on which allele was lost) were considered to be indicative of allelic imbalance, although the majority of loci showed complete loss of an allele.
Figure 7
Figure 7
Allelic imbalance throughout the genome in aneuploid populations derived from high-grade dysplasia (HGD) and cancer (CA) cells. Genomic DNA was obtained from both a flow-purified aneuploid population and constitutional DNA from a gastric control biopsy for each patient. (Short black bars) Non-informative loci; (gray bars) retention of heterozygous loci; (tall black bars) SNP loci with allelic imbalance. The x-axis shows chromosome number, separated by downward tick marks. The distance between chromosomes is representational and does not equal map distance. Loci that did not pass the quality test were excluded.
Figure 8
Figure 8
Comparison of the SNP array-based and microsatellite STR-based analyses for chromosomes 9, 17, and 18. For each normal and aneuploid pair, the SNP results are shown on the left and the STR results on the right. For the SNP data, allelic imbalance was called if the value for the normal sample was within the range 25 ≤ ≤ 75, the value for the aneuploid samples was 25 or ≥ 75, and if |Δ| > 20 between normal and aneuploid samples. For the STR data, allelic imbalance was determined by use of the formula [aneuploid allele height A/B]/[normal allele height A/B] and was called if the ratio was <0.4 or >2.5, depending on which allele was lost. (Open rectangles) Retention of heterozygosity; (closed rectangles) allelic imbalance; (hatched rectangles) non-informative loci. The two techniques were said to be in agreement if adjacent loci from both approaches showed either allelic imbalance or if both were heterozygous (excluding regions that were non-informative). (*) STR markers with allele ratios that were only slightly below the threshold for scoring LOH. These may represent instances of polysomy.
Figure 9
Figure 9
Test of array-based difference detection in heterogeneous populations. The DNA derived from the aneuploid population was mixed into DNA derived from the same patient’s normal cells with increasing percentages of 0%, 5%, 10%, 25%, 50%, 75%, 90%, 95%, and 100%. The mixing was performed either prior to or after the locus-specific multiplex PCR and the labeling PCR. (A) The behavior of a single locus with increasing amounts of aneuploid DNA. (Red solid triangles and open black triangles) Values for the sample mixed before and after PCR, respectively; (solid black line) simple linear fit for the two sets of data. The broken lines are theoretical, indicating what would be expected in an ideal case. (B) The behavior of the average of 13 or 15 loci with increasing amounts of aneuploid DNA. (Open black squares and circles) Average values from either 13 loci (changed in the AA direction) or 15 loci (changed in the BB direction) for the samples mixed before the PCR; (red solid triangles and diamond) average values for the samples mixed after the PCR. The error bars represent the standard deviation of the average values from either 13 or 15 markers. (Solid and broken lines) as described in Fig. 8A. (C) Comparison of genome-wide difference scans for the 50% mixture and the 100% aneuploid samples. (Pink and black lines) Scans for the 50% mixture and 100% aneuploid samples, respectively. Only informative markers are shown (410 markers passed the quality analysis for all the mixtures and 138 markers were informative for this individual).

References

    1. Baccichet A, Qualman SK, Sinnett D. Allelic loss in childhood acute lymphoblastic leukemia. Leuk Res. 1997;21:817–823. - PubMed
    1. Barrett MT, Galipeau PC, Sanchez CA, Emond MJ, Reid BJ. Determination of the frequency of loss of heterozygosity in esophageal adenocarcinoma by cell sorting, whole genome amplification and microsatellite polymorphisms. Oncogene. 1996;12:1873–1878. - PubMed
    1. Barrett MT, Sanchez CA, Prevo LJ, Wong DJ, Galipeau PC, Ravinovitch PS, Reid BJ. Evolution of neoplastic cell lineages in Barrett oesophagus. Nature Genet. 1999;23:106–109. - PMC - PubMed
    1. Boige V, Laurent-Puig P, Fouchet P, Flejou JF, Monges G, Bedossa P, Bioulac-Sage P, Capron F, Schmitz A, Olschwang S, et al. Concerted nonsyntenic allelic losses in hyperploid hepatocellular carcinoma as determined by a high-resolution allelotype. Cancer Res. 1997;57:1986–1990. - PubMed
    1. Brown MA. Tumor suppressor genes and human cancer. Adv Genet. 1997;36:45–135. - PubMed

Publication types

MeSH terms

LinkOut - more resources