. 2000 Sep;20(18):6668-76.
doi: 10.1128/MCB.20.18.6668-6676.2000.

Preferential accessibility of the yeast his3 promoter is determined by a general property of the DNA sequence, not by specific elements

Affiliations

Preferential accessibility of the yeast his3 promoter is determined by a general property of the DNA sequence, not by specific elements

X Mai et al. Mol Cell Biol. 2000 Sep.

Abstract

Yeast promoter regions are often more accessible to nuclear proteins than are nonpromoter regions. As assayed by HinfI endonuclease cleavage in living yeast cells, HinfI sites located in the promoters of all seven genes tested were 5- to 20-fold more accessible than sites in adjacent nonpromoter regions. HinfI hypersensitivity within the his3 promoter region is locally determined, since it was observed when this region was translocated to the middle of the ade2 structural gene. Detailed analysis of the his3 promoter indicated that preferential accessibility is not determined by specific elements such as the Gcn4 binding site, poly(dA-dT) sequences, TATA elements, or initiator elements or by transcriptional activity. However, progressive deletion of the promoter region in either direction resulted in a progressive loss of HinfI accessibility. Preferential accessibility is independent of the Swi-Snf chromatin remodeling complex, Gcn5 histone acetylase complexes Ada and SAGA, and Rad6, which ubiquitinates histone H2B. These results suggest that preferential accessibility of the his3 (and presumably other) promoter regions is determined by a general property of the DNA sequence (e.g., base composition or a related feature) rather than by defined sequence elements. The organization of the compact yeast genome into inherently distinct promoter and nonpromoter regions may ensure that transcription factors bind preferentially to appropriate sites in promoters rather than to the excess of irrelevant but equally high-affinity sites in nonpromoter regions.


Figures

FIG. 1
FIG. 1
Growth phenotypes and HinfI cleavage in vivo in yeast strains containing pHinfI. (A) Strain ySH104 transformed with the indicated plasmids was grown on synthetic complete solid medium lacking uracil and tryptophan and containing the indicated concentrations of CuSO4. (B) Southern blots of genomic DNAs from strain ySH104, transformed with pHinfI and either vector or the CUP1-overexpressing plasmid pSH212, grown in selective liquid medium, and induced with 1 mM CuSO4 for the indicated time periods. As a control, genomic DNA from untransformed ySH104 cells was also partially digested with HinfI in vitro (N). Open boxes indicate coding regions, arrows indicate the 5′-to-3′ orientation of genes, long transecting lines indicate Gcn4 consensus or near-consensus binding sites, and short lines indicate other HinfI restriction sites. Relative HinfI cleavage at the numbered genomic sites was calculated based on quantitation of band intensity by using ImageGauge (Fujimax) and normalized to the lowest-intensity band.
FIG. 2
FIG. 2
HinfI cleaves preferentially in promoter regions in vivo. Gcn4-dependent genes (CPA1, LYS2, ILS1, CPA2, and HIS3), Gcn4-independent genes (RDN37 and YOR205C), and adjacent genomic regions were analyzed. Genomic DNA was prepared from strain ySH104, containing pSH212 and pHinfI, that was induced with 1.5 mM CuSO4 for 90 min, and the DNA was hybridized to the indicated probes. As a control, genomic DNA from untransformed ySH104 cells was also partially digested with HinfI in vitro (N). Schematics are as described in the legend to Fig. 1B. Relative HinfI cleavage at the numbered genomic sites was calculated based on quantitation of band intensity by using ImageGauge (Fujimax) and normalized to the lowest-intensity band.
FIG. 3
FIG. 3
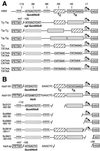
Structures of his3 promoter derivatives. (A) his3 promoter derivatives containing an optimal Gcn4 site with various TATA element combinations in addition to a deletion of the pet56 promoter (upstream deletion) (14). (B) his3 promoter derivatives containing a deletion of the pet56 promoter (upstream deletion), the short proximal T tract (his3-161), or a nonfunctional Gcn4 site in addition to his3-151 (11); derivatives containing wild-type upstream sequence of the pet56 promoter and deletions of various portions of the core promoter region (; K. Struhl, unpublished data); and the his3-Δp derivative constructed here. Arrows represent transcriptional start sites, open boxes indicate the HIS3 coding region, and shaded boxes represent promoter elements as indicated. Numbering is relative to the +1 transcriptional start site of HIS3. The drawing is not to scale.
FIG. 4
FIG. 4
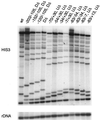
HinfI hypersensitivity at the his3 Gcn4 binding site is unaffected by any of the previously defined promoter elements. Shown are Southern blots of DNA subjected to in vivo HinfI cleavage at his3 promoter derivatives with TATA element combinations (see Fig. 3A) and rDNA controls (A), his3 promoter deletions (see Fig. 4B) (B), and his3 alleles −161 (proximal T tract deletion) and −151 (nonfunctional Gcn4 site) (see panel B) (C). Genomic DNA was prepared from the corresponding strains, containing pSH212 and pHinfI, that were induced with 1.5 mM CuSO4 for 90 min, and the DNA was hybridized to the indicated probes. As a control, genomic DNA from untransformed cells was also partially digested with HinfI in vitro (N). HinfI cleavage at the Gcn4 binding site (indicated with arrows) and five adjacent genomic sites was quantitated by phosphorimager analysis (Fujimax) and normalized to the lowest-intensity site, and the averaged cleavage of the five adjacent HinfI sites was used to calculate the relative HinfI preference for the Gcn4 binding site (averaged HinfI preference). The standard deviation of normalized cleavage at the adjacent sites ranged between 0.6 and 1.4.
FIG. 5
FIG. 5
Structures of his3 promoter derivatives. (A) his3 promoter derivatives containing a downstream deletion (DΔ) of positions −83 to +30 and the indicated deletions upstream of the Gcn4 binding site. (B) his3 promoter derivatives containing an upstream deletion (UΔ) of positions −447 to −105 and the indicated deletions downstream of the Gcn4 binding site originating from the 3′ end. (C) his3 promoter derivatives containing an upstream deletion (UΔ) of positions −447 to −105 and the indicated deletions downstream of the Gcn4 binding site originating from the 5′ end. Arrows represent transcriptional start sites of his3 and pet56. Numbering is relative to the +1 transcriptional start site of HIS3. Open boxes represent the sequence, and black boxes represent the Gcn4 binding site. The drawing is not to scale. WT, wild type.
FIG. 6
FIG. 6
HinfI cleavage of purified genomic DNAs from strains containing his3 promoter derivatives shown in Fig. 5. Southern blots containing 25% of the amount of DNA used in Fig. 7 were hybridized with his3 (the second band from the bottom represents the HinfI site within the Gcn4 binding sequence) and rDNA probes. wt, wild type.
FIG. 7
FIG. 7
Progressive deletion of the his3 promoter region in either direction causes a progressive loss of HinfI hypersensitivity. Shown are Southern blots of in vivo HinfI-cleaved DNA from strains containing his3 promoter derivatives lacking downstream sequence with various deletions of upstream sequence (see Fig. 5A) and rDNA controls (A), his3 promoter derivatives lacking upstream sequence with various deletions of downstream sequence from the 3′ end (see Fig. 5B) and rDNA controls (B), and his3 promoter derivatives lacking upstream sequence with various deletions of downstream from the 5′ end (see Fig. 5C) and rDNA controls (C). Genomic DNA was prepared from the corresponding strains, containing pHinfI, that were induced with 1 mM CuSO4 for 90 min, and the DNA was hybridized to the indicated probes. As a general control, genomic DNA from SH104 without pHinfI was also partially digested with HinfI in vitro (N). wt, wild type.
FIG. 8
FIG. 8
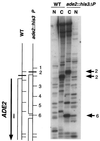
The his3 promoter region is sufficient to confer accessibility when located within the ADE2 structural gene. Shown is a Southern blot of genomic DNAs from strains containing the wild-type (WT) ADE2 or ade2::his3p alleles and pHinfI that were induced for 90 min with 1 mM CuSO4 (C) or untransformed cells partially digested with HinfI in vitro (N). For the wild-type and mutant alleles, open boxes represent the ADE2 coding region (the long arrow indicates the 5′-to-3′ orientation of ADE2), the vertical gray bar under the vertical long arrow indicates the inserted 150-bp his3 promoter region, and short horizontal lines indicate HinfI restriction sites. Band 6 corresponds to the Gcn4 binding site within the inserted his3 promoter, and band 2 (whose mobility differs in the wild-type and mutant alleles) corresponds to the Gcn4 binding site within the ade2 promoter region and serves as an internal control.
FIG. 9
FIG. 9
Swi-Snf, SAGA, and Ada complexes and Rad6 are not responsible for the HinfI hypersensitivity at the his3 Gcn4 site. Wild-type (WT) and rad6, ahc1, snf2, or gcn5 deletion strains that contain pHinfI were induced with 1 mM CuSO4 for 90 min, and genomic DNAs were analyzed by Southern blotting with his3 and rDNA probes. As a control, genomic DNA from the wild-type strain was partially digested with HinfI in vitro (N). Preferential HinfI cleavage at the Gcn4 binding site (indicated by an arrow) was determined with respect to the average cleavage of three adjacent genomic sites.

References

    1. Axelrod J D, Majors J. GAL4 disrupts a nucleosome to activate GAL1 transcription in vivo. Genes Dev. 1993;7:857–869. - PubMed
    1. Chen W, Struhl K. Yeast mRNA initiation sites are determined primarily by specific sequences, not by the distance from the TATA element. EMBO J. 1985;4:3273–3280. - PMC - PubMed
    1. Chen W, Struhl K. Saturation mutagenesis of a yeast his3 TATA element: genetic evidence for a specific TATA-binding protein. Proc Natl Acad Sci USA. 1988;85:2691–2695. - PMC - PubMed
    1. Drew H R, Travers A A. DNA bending and its relation to nucleosome positioning. J Mol Biol. 1985;186:773–790. - PubMed
    1. Eibel H, Philippsen P. Preferential integration of yeast transposable element Ty into a promoter region. Nature. 1984;307:386–388. - PubMed

Publication types

MeSH terms

Substances

LinkOut - more resources