. 2000 Sep;20(18):6677-85.
doi: 10.1128/MCB.20.18.6677-6685.2000.

Functions of E2A-HEB heterodimers in T-cell development revealed by a dominant negative mutation of HEB

Affiliations

Functions of E2A-HEB heterodimers in T-cell development revealed by a dominant negative mutation of HEB

R J Barndt et al. Mol Cell Biol. 2000 Sep.

Abstract

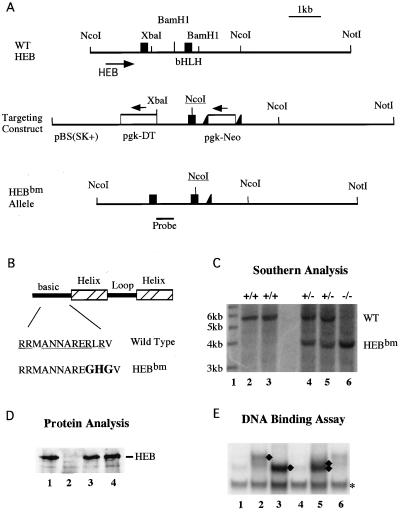
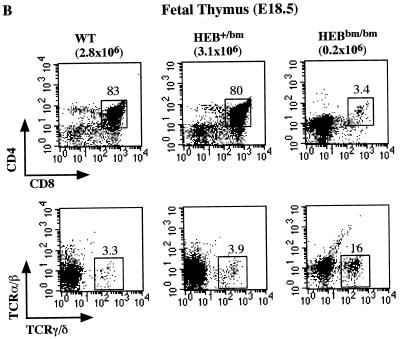
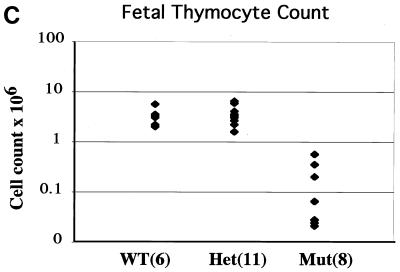
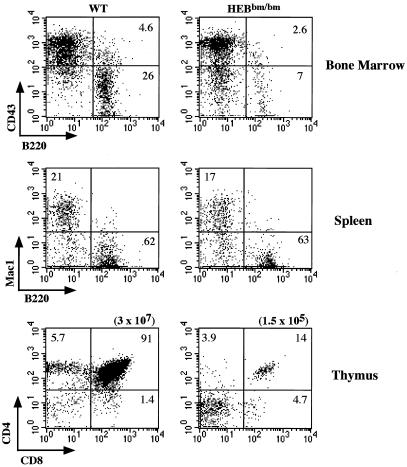
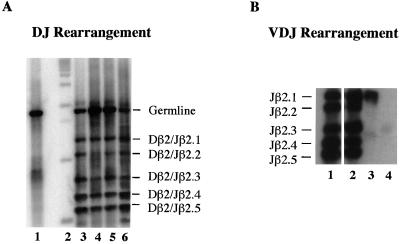
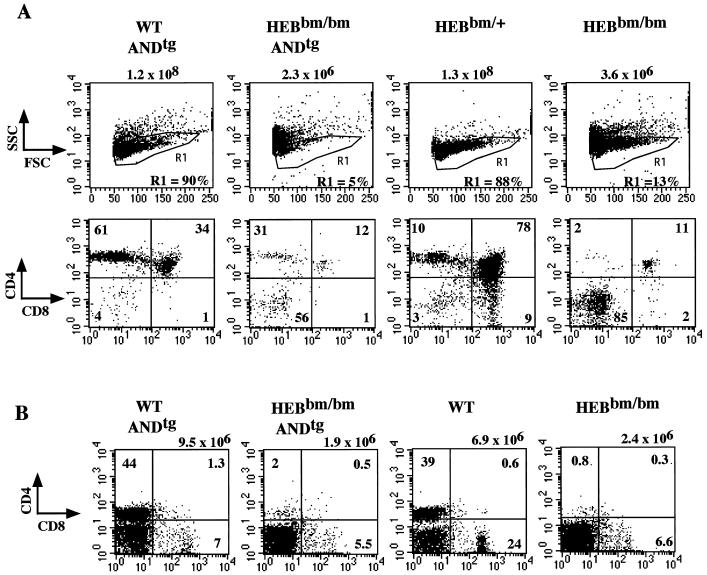
Lymphocyte development and differentiation are regulated by the basic helix-loop-helix (bHLH) transcription factors encoded by the E2A and HEB genes. These bHLH proteins bind to E-box enhancers in the form of homodimers or heterodimers and, consequently, activate transcription of the target genes. E2A homodimers are the predominant bHLH proteins present in B-lineage cells and are shown genetically to play critical roles in B-cell development. E2A-HEB heterodimers, the major bHLH dimers found in thymocyte extracts, are thought to play a similar role in T-cell development. However, disruption of either the E2A or HEB gene led to only partial blocks in T-cell development. The exact role of E2A-HEB heterodimers and possibly the E2A and HEB homodimers in T-cell development cannot be distinguished in simple disruption analysis due to a functional compensation from the residual bHLH homodimers. To further define the function of E2A-HEB heterodimers, we generated and analyzed a dominant negative allele of HEB, which produces a physiological amount of HEB proteins capable of forming nonfunctional heterodimers with E2A proteins. Mice carrying this mutation show a stronger and earlier block in T-cell development than HEB complete knockout mice. The developmental block is specific to the alpha/beta T-cell lineage at a stage before the completion of V(D)J recombination at the TCRbeta gene locus. This defect is intrinsic to the T-cell lineage and cannot be rescued by expression of a functional T-cell receptor transgene. These results indicate that E2A-HEB heterodimers play obligatory roles both before and after TCRbeta gene rearrangement during the alpha/beta lineage T-cell development.


Figures

FIG. 1
FIG. 1
EMSA analysis of E-protein dimer formation on the CD4-3 E-box DNA. Thymocyte extracts from wild-type (WT) (lanes 1 to 3), HEBko heterozygous (lanes 4 to 6), HEBko homozygous (lanes 7 to 9), E2Ako heterozygous (lanes 10 to 12), and E2Ako homozygous (lanes 13 to 14) mice were incubated with 32P-labeled CD4-3 DNA in the absence of antibodies (lanes 1, 4, 7, 10, and 13), in the presence of anti-HEB antiserum (lanes 2, 5, 8, 11, and 14), or in the presence in anti-E2A antibody Yae (lanes 3, 6, 9, 12, and 15). Arrows on the left (A, B, and C) indicate CD4-3-bound E-protein dimer complexes, the E2A-dependent supershift complexes, and the HEB-dependent supershift complexes, respectively.
FIG. 2
FIG. 2
Generation of the HEBbm allele. (A) Schematic diagrams of the bHLH region of the HEB gene (top), the gene targeting construct (middle), and the final knockin HEBbm allele. Filled boxes and open boxes represent exons and selection markers, respectively. Intron and vector sequences are shown as single lines. LoxP insertions on each side of the Neo cassette are indicated by filled triangles. The positions of restriction sites and the probe relevant to the Southern analysis are indicated. The basic region mutation was introduced along with a NcoI site (underlined) into the bHLH encoding exon. WT, wild type. (B) The sequence of the basic region of HEB. Underlines indicate amino acids conserved among all E-proteins. Sequences mutated are shown in boldface. (C) Southern blot analysis of tail DNA digested with NcoI. The wild-type and HEBbm alleles are identified as 5.8- and 3.8-kb fragments, respectively, in the blot. Lane 1 contains an end-labeled 1-kb ladder as size markers. The size of each marker band is shown on the left. Two wild-type samples (lanes 2 and 3), two HEBbm heterozygous samples (lanes 4 and 5), and one HEBbm homozygous sample (lane 6) are shown in the blot. (D) Western analysis of thymocyte nuclear extracts for HEB and HEBbm proteins. Lanes: 1, wild type; 2, HEBko homozygote; 3, HEBko/bm compound heterozygote; 4, HEBbm heterozygote. Ten micrograms of proteins was loaded in each lane. (E) EMSA of HEBbm proteins. Proteins synthesized from programmed reticulocyte lysates were incubated with end-labeled CD4-3 probe. Lanes contain the following: lane 1, 3 μl of reticulocyte lysates (RL) without any RNA added in protein synthesis; lane 2, 3 μl of E47 proteins; lane 3, 3 μl of HEB proteins; lane 4, 3 μl of HEBbm proteins; lane 5, 3 μl of E47 plus 3 μl of HEB proteins; and lane 6, 3 μl of E47 plus 2 μl of HEBbm proteins. The E47, HEB, and HEBbm proteins synthesized in the programmed RL were in equal concentrations determined by a 35S protein gel (data not shown). Diamonds indicate bound E47 homodimers, HEB homodimers, and E47-HEB heterodimers; the asterisk indicates an unrelated RL-dependent shift.
FIG. 3
FIG. 3
FACS analysis of B- and T-cell development in HEBbm mice. (A) Analysis of bone marrow (top) and lymph node (bottom) cells from adult HEBbm/+ and HEBbm/bm mice. CD43 and B220 markers were used to separate pro-B cells (CD43+ B220+), pre- and immature B cells (CD43low B220+), and mature B cells (CD43 B220high) in the bone marrow. TCRβ and B220 markers were used to separate T and B cells, respectively, in the lymph nodes. The relative percentage for each population is shown in the plots. Inguinal lymph nodes were collected from each animal, with the total cell numbers given on top of the plots. (B) E18.5 fetal thymus of wild-type, HEBbm/+, and HEBbm/bm thymocytes were analyzed in three separate stainings for CD4 and CD8 (top) and TCRα/β and TCRγ/δ (bottom) markers. CD4-, CD8-, and TCR-positive cells were gated out in the bottom panel. Cell counts of total thymocytes and individual populations are shown in the plots. Data are representative of multiple tests (n = 7 for HEBbm/bm). Events displayed for all plots in A and B are after size and 7AAD gating, which eliminates nonlymphoid and dead cells, respectively. (C) Cell count of E18.5 fetal thymus collected from five litters of timed mating between HEBbm heterozygous mice. Numbers of fetuses for each genotype included in the analysis are shown next to the genotype name in the chart. Means and standard deviations (in parentheses) for wild type, HEBbm/+, and HEBbm/bm are 3.3 (1.4) × 106, 3.6 (1.5) × 106, and 0.2 (0.2) × 106, respectively. Two-tailed t test shows a statistical difference between wild type and HEBbm/bm (P = 1.7 × 10⁻⁵) and no significant difference between wild type and HEBbm/+ (P = 0.7).
FIG. 3
FIG. 3
FACS analysis of B- and T-cell development in HEBbm mice. (A) Analysis of bone marrow (top) and lymph node (bottom) cells from adult HEBbm/+ and HEBbm/bm mice. CD43 and B220 markers were used to separate pro-B cells (CD43+ B220+), pre- and immature B cells (CD43low B220+), and mature B cells (CD43 B220high) in the bone marrow. TCRβ and B220 markers were used to separate T and B cells, respectively, in the lymph nodes. The relative percentage for each population is shown in the plots. Inguinal lymph nodes were collected from each animal, with the total cell numbers given on top of the plots. (B) E18.5 fetal thymus of wild-type, HEBbm/+, and HEBbm/bm thymocytes were analyzed in three separate stainings for CD4 and CD8 (top) and TCRα/β and TCRγ/δ (bottom) markers. CD4-, CD8-, and TCR-positive cells were gated out in the bottom panel. Cell counts of total thymocytes and individual populations are shown in the plots. Data are representative of multiple tests (n = 7 for HEBbm/bm). Events displayed for all plots in A and B are after size and 7AAD gating, which eliminates nonlymphoid and dead cells, respectively. (C) Cell count of E18.5 fetal thymus collected from five litters of timed mating between HEBbm heterozygous mice. Numbers of fetuses for each genotype included in the analysis are shown next to the genotype name in the chart. Means and standard deviations (in parentheses) for wild type, HEBbm/+, and HEBbm/bm are 3.3 (1.4) × 106, 3.6 (1.5) × 106, and 0.2 (0.2) × 106, respectively. Two-tailed t test shows a statistical difference between wild type and HEBbm/bm (P = 1.7 × 10⁻⁵) and no significant difference between wild type and HEBbm/+ (P = 0.7).
FIG. 4
FIG. 4
FACS analysis of thymocytes from mice carrying various HEB alleles. (A) Two- to three-week-old mice were used in the analysis, with genotype and thymocyte count shown on the top. CD4 and CD8 plots were drawn after eliminating nonlymphocytes and dead cells in the size scatter and 7AAD plots, respectively. The relative percentage of cells in each quadrant was given in the plots. Data are representative of multiple tests including 8 wild-type and HEB+/ko mice, 8 HEBko/ko mice, 3 HEBko/bm mice, and 4 HEBbm/bm mice.
FIG. 5
FIG. 5
Adoptive transfer test of wild-type (left) and HEBbm/bm (right) stem cells into wild-type hosts. Bone marrow cells (1 to 2 × 10⁵) from wild-type or HEBbm homozygous neonates were transferred into C57BL/6 Ly5A congenic mice irradiated with 1,100 rads. Bone marrow cells, splenocytes, and thymocytes were collected and analyzed 1 month after adoptive transfer. A four-color flow cytometry test was carried out with CD45.2-fluorescein isothiocyanate (donor-specific marker) and 7AAD included in all experiments. The CD45.2+ 7AAD cells were analyzed with CD43-pe and B220-apc markers for bone marrow cells, Mac1-pe and B220-apc for splenocytes, and CD8-pe and CD4-apc for thymocytes. Total thymocytes recovered from the wild type transfer and HEBbm/bm mutant transfer were indicated on the top of the plots. Data are representative of three separate sets of transfer experiment.
FIG. 6
FIG. 6
(A) PCR analysis of TCRβ gene DJ rearrangement. DNA samples were prepared from either total thymocytes or sorted CD25+ CD44 DN3 cells of 2- to 3-week-old mice. DJ rearrangement products from the Dβ2 and Jβ2 region were analyzed by PCR with Dβ2 and Jβ2.6 primers. PCR products were blotted and hybridized with a J segment-specific probe. The expected DJ rearrangement products are indicated on the right. Samples in the blot are toe DNA (lane 1), a 1-kb size ladder (lane 2), wild-type total thymocytes (lane 3), HEBbm/bm total thymocytes (lane 4), HEBbm/bm DN3 cells (lane 5), and wild-type DN3 cells (lane 6). (B) PCR analysis of TCRβ gene VDJ rearrangement. DNA used in the DJ rearrangement assay were PCR amplified with Vβ8 and Jβ2.6 primers. PCR products with expected Jβ usage are indicated on the left. Samples in the blot are wild-type total thymocytes (lane 1), wild-type DN3 cells (lane 2), HEBbm/bm total thymocytes (lane 3), and HEBbm/bm DN3 cells (lane 4). Similar results were obtained with Vβ5 and Jβ2.6 primers.
FIG. 7
FIG. 7
The AND TCR transgene cannot rescue the HEBbm mutation. (A) E18.5 fetal thymuses were analyzed by costaining with CD8, CD4, and TCR antibodies. Size plots are shown with genotypes indicated on the top. Cells highlighted in the R1 gate in the size plots (top panel) are displayed for CD4/CD8 staining (bottom panel). Data are representative of multiple litters. (B) Lymph nodes of single and double transgenic mice were analyzed with CD8, CD4, and 7AAD. The percentages of CD4 single positive and CD8 single positive populations are indicated in the CD4/CD8 plots. The total cell number of inguinal lymph nodes for each genotype analyzed is given on the top. Similar results were obtained from the analysis of splenocytes.

References

    1. Bain G, Gruenwald S, Murre C. E2A and E2-2 are subunits of B-cell-specific E2-box DNA-binding proteins. Mol Cell Biol. 1993;13:3522–3529. - PMC - PubMed
    1. Bain G, Maandag E C, Izon D J, Amsen D, Kruisbeek A M, Weintraub B C, Krop I, Schlissel M S, Feeney A J, van Roon M, van der Valk M, te Riele H P J, Berns A, Murre C. E2A proteins are required for proper B cell development and initiation of immunoglobulin gene rearrangements. Cell. 1994;79:885–892. - PubMed
    1. Bain G, Maandag E C R, te Riele H P, Feeney A J, Sheehy A, Schlissel M, Shinton S A, Hardy R R, Murre C. Both E12 and E47 allow commitment to the B cell lineage. Immunity. 1997;6:145–154. - PubMed
    1. Bain G, Engel I, Maandag E C R, te Reile H P J, Voland J R, Sharp L L, Chun J, Huey B, Pinkel D, Murre C. E2A deficiency leads to abnormalities in α/β T-cell development and to rapid development of T-cell lymphomas. Mol Cell Biol. 1997;17:4782–4791. - PMC - PubMed
    1. Barndt R J, Dai M F, Zhuang Y. A novel role for HEB downstream or parallel to the pre-TCR signal during alpha/beta thymopoiesis. J Immunology. 1999;163:3331–3343. - PubMed

Publication types

MeSH terms

Substances