. 2000 Jun;33(3):147-66.
doi: 10.1046/j.1365-2184.2000.00175.x.

Heat shock-induced arrests in different cell cycle phases of rat C6-glioma cells are attenuated in heat shock-primed thermotolerant cells

Affiliations

Heat shock-induced arrests in different cell cycle phases of rat C6-glioma cells are attenuated in heat shock-primed thermotolerant cells

N M Kühl et al. Cell Prolif. 2000 Jun.

Abstract

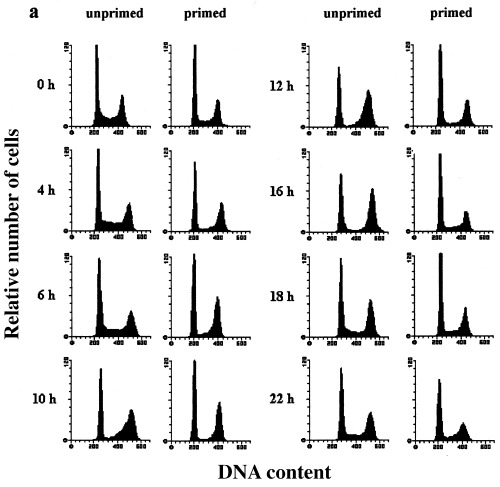
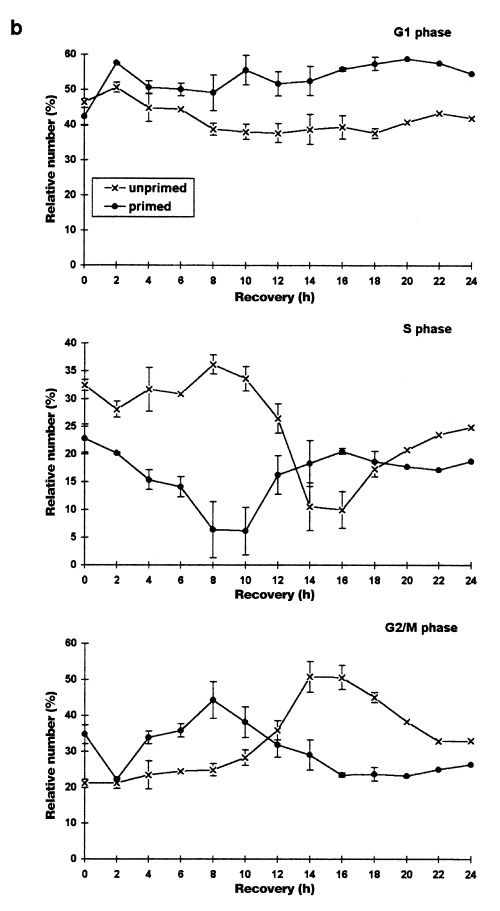
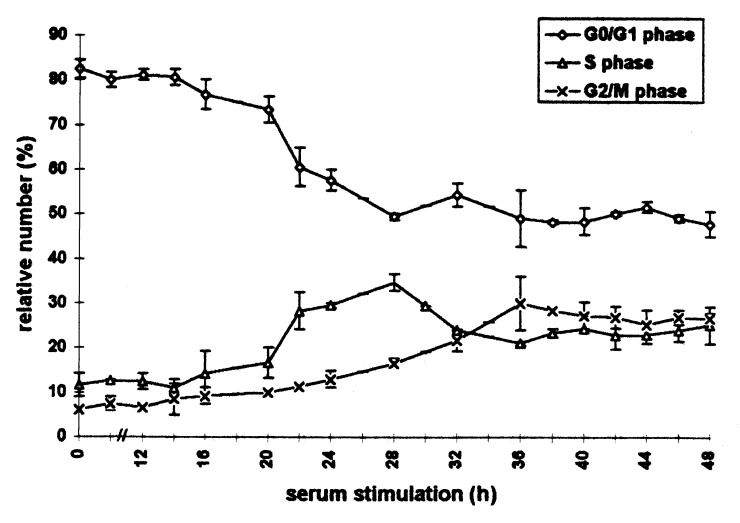
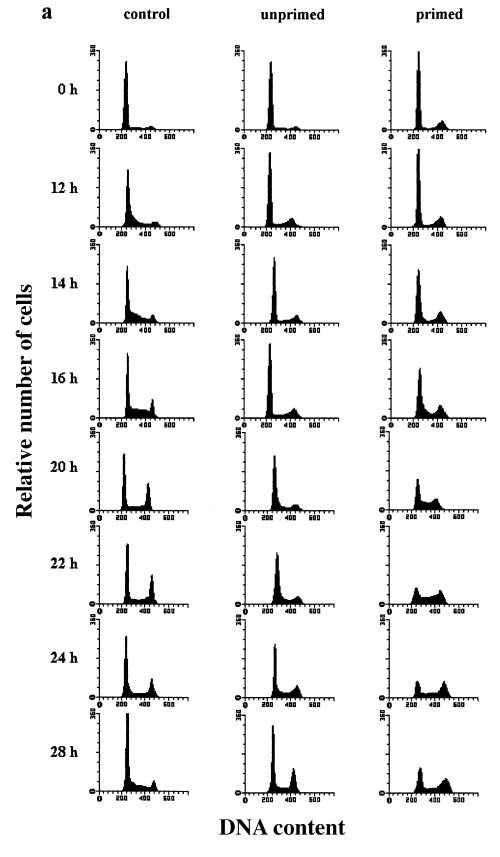
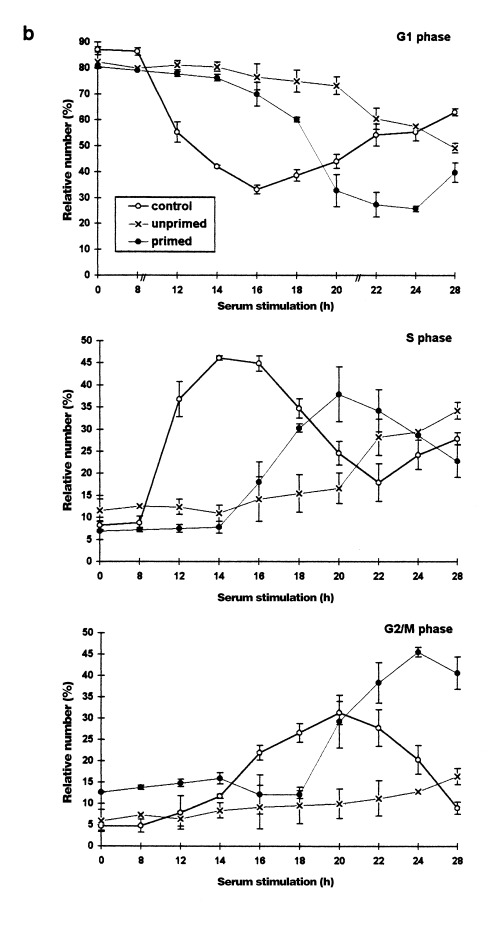
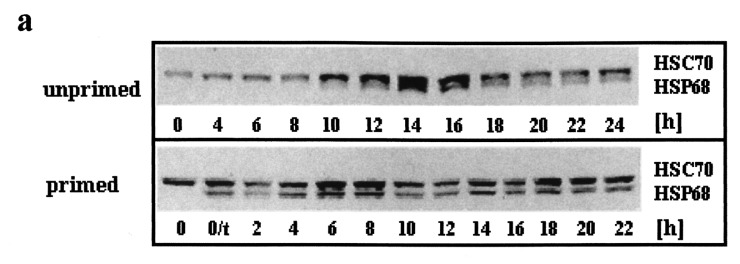
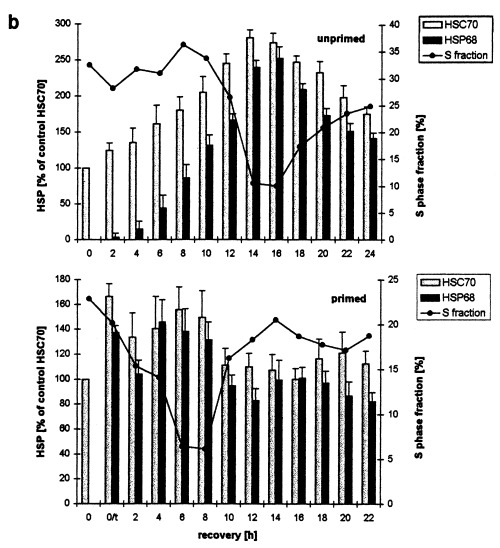
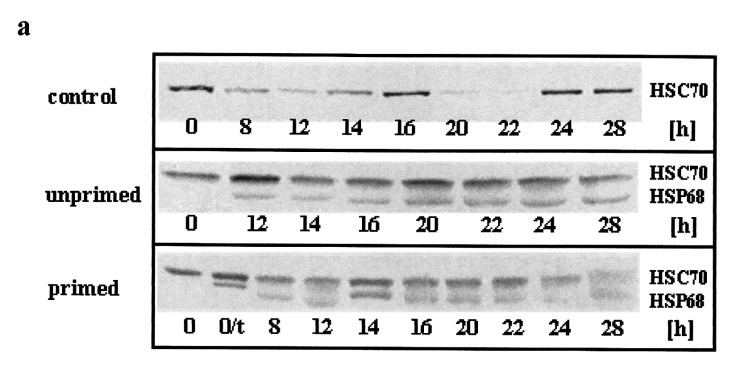
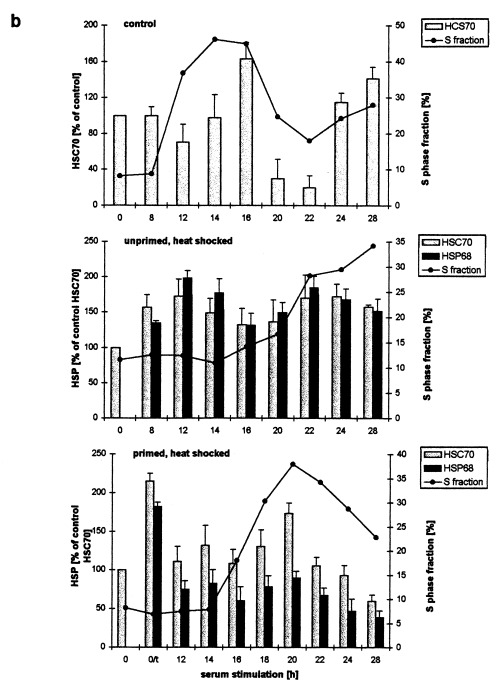
The response kinetics of rat C6 glioma cells to heat shock was investigated by means of flow cytometric DNA measurements and western blot analysis of HSP levels. The results showed that the effects on cell cycle progression are dependent on the cell cycle phase at which heat shock is applied, leading to either G1 or G2/M arrest in randomly proliferating cells. When synchronous cultures were stressed during G0 they were arrested with G1 DNA content and showed prolongation of S and G2 phases after release from the block. In proliferating cells, HSC70 and HSP68 were induced during the recovery and reached maximum levels just before cells were released from the cell cycle blocks. Hyperthermic pretreatment induced thermotolerance both in asynchronous and synchronous cultures as evidenced by the reduced arrest of cell cycle progression after the second heat shock. Thermotolerance development was independent of the cell cycle phase. Pre-treated cells already had high HSP levels and did not further increase the amount of HSP after the second treatment. However, as in unprimed cells, HSP reduction coincided with the release from the cell cycle blocks. These results imply that the cell cycle machinery can be rendered thermotolerant by heat shock pretreatment and supports the assumption that HSP70 family members might be involved in thermotolerance development.


Figures

Figure 1
Figure 1
Heat shock effects on the cell cycle distribution of asynchronously proliferating rat C6 cells analysed by flow cytometry. Asynchronously proliferating normal and primed C6 cells were heat‐shocked at 44 °C for 30 min and harvested after the indicated recovery times.(a) Representative DNA‐histograms of C6 cells analysed by flow cytometry. DNA‐content based on PI‐fluorescence (x axis) is plotted against relative number of cells (10 000 cells per histogram; y axis)(b) Quantitative analysis of DNA‐histograms using the Lysis II and Cellfit research programs (Becton Dickinson, San Jose, CA, USA). The proportion of cells in different phases of the cell cycle (top panel: G1 phase, mid panel: S phase, bottom panel: G2/M phase) is plotted against the recovery time. (×): heat‐shocked cells (●): primed cells. Values are means (±SE) of at least three independent experiments.
Figure 1
Figure 1
Heat shock effects on the cell cycle distribution of asynchronously proliferating rat C6 cells analysed by flow cytometry. Asynchronously proliferating normal and primed C6 cells were heat‐shocked at 44 °C for 30 min and harvested after the indicated recovery times.(a) Representative DNA‐histograms of C6 cells analysed by flow cytometry. DNA‐content based on PI‐fluorescence (x axis) is plotted against relative number of cells (10 000 cells per histogram; y axis)(b) Quantitative analysis of DNA‐histograms using the Lysis II and Cellfit research programs (Becton Dickinson, San Jose, CA, USA). The proportion of cells in different phases of the cell cycle (top panel: G1 phase, mid panel: S phase, bottom panel: G2/M phase) is plotted against the recovery time. (×): heat‐shocked cells (●): primed cells. Values are means (±SE) of at least three independent experiments.
Figure 3
Figure 3
Cell cycle distribution of heat‐shocked C6 cells after serum stimulation analysed by flow cytometry for 48 h. Rat C6 glioma scells synchronized by serum deprivation were heat‐shocked (44 °C, 30 min) directly after serum stimulation and harvested at the indicated times. After flow cytometric measurement, quantitative analysis of DNA‐histograms was performed using the Lysis II and Cellfit research programs (Becton Dickinson, San Jose, California). The proportion of cells in different phases of the cell cycle is plotted against the time of serum stimulation. (○): G1 phase (△): S phase (×): G2/M phase. Values are means (±SE) of three independent experiments.
Figure 2
Figure 2
Heat shock effects on the cell cycle distribution of serum‐stimulated (synchronized) rat C6 cells analysed by flow cytometry. C6 cells synchronized by serum deprivation were stimulated to reenter the cell cycle by shifting the serum concentration to 20% (control cells). Unprimed cells were heat shocked (44 °C, 30 min) directly after serum stimulation. Primed cells were heat‐shocked (44 °C, 30 min) 24 h previously and then heat shocked again directely after serum stimulation. (a) Representative DNA‐histograms of cells harvested at the indicated times after serum stimulation. DNA‐content based on PI‐fluorescence (x axis), is plotted against relative number of cells (10 000 cells per histogram; yaxis). (b) Quantitative analysis of DNA‐histograms using the Lysis II and Cellfit research programs (Becton Dickinson). The proportion of cells in different phases of the cell cycle (top panel: G1 phase, mid panel: S phase, bottom panel: G2/M phase) is plotted against the time of serum stimulation. (○): control cells (×): heat‐shocked cells (●): primed cells. Values are means (±SE) of at least three independent experiments.
Figure 2
Figure 2
Heat shock effects on the cell cycle distribution of serum‐stimulated (synchronized) rat C6 cells analysed by flow cytometry. C6 cells synchronized by serum deprivation were stimulated to reenter the cell cycle by shifting the serum concentration to 20% (control cells). Unprimed cells were heat shocked (44 °C, 30 min) directly after serum stimulation. Primed cells were heat‐shocked (44 °C, 30 min) 24 h previously and then heat shocked again directely after serum stimulation. (a) Representative DNA‐histograms of cells harvested at the indicated times after serum stimulation. DNA‐content based on PI‐fluorescence (x axis), is plotted against relative number of cells (10 000 cells per histogram; yaxis). (b) Quantitative analysis of DNA‐histograms using the Lysis II and Cellfit research programs (Becton Dickinson). The proportion of cells in different phases of the cell cycle (top panel: G1 phase, mid panel: S phase, bottom panel: G2/M phase) is plotted against the time of serum stimulation. (○): control cells (×): heat‐shocked cells (●): primed cells. Values are means (±SE) of at least three independent experiments.
Figure 4
Figure 4
Western blot determination of HSC70 and HSP68 levels in asynchronously proliferating C6 cells after heat shock. Primed and unprimed cells (0 h) were heat shocked (30 min, 44 °C), harvested after the indicated recovery times at 37 °C and analysed by western blot. (a) Representative immunodetection using the SPA‐820 antibody that recognizes HSC70 as well as HSP68. (b) Western blots of unprimed (top panel) and primed C6 (lower panel) were quantitatively evaluated by video scanning measurement using the CREAM research software (Ver 4.1). Values of HSC70 (grey columns) and HSP68 (black columns) are relative amounts of pixel density given in percentage of the HSC70 value of unstressed, unprimed C6 cells (left ordinate) and are plotted against the recovery time. The fraction of cells in S phase is displayed as a line (right ordinate, see Figure 1 for other fractions). 0/t: primed C6 cells directly before the second heat shock. Values are means (±SE) of at least three independent experiments.
Figure 4
Figure 4
Western blot determination of HSC70 and HSP68 levels in asynchronously proliferating C6 cells after heat shock. Primed and unprimed cells (0 h) were heat shocked (30 min, 44 °C), harvested after the indicated recovery times at 37 °C and analysed by western blot. (a) Representative immunodetection using the SPA‐820 antibody that recognizes HSC70 as well as HSP68. (b) Western blots of unprimed (top panel) and primed C6 (lower panel) were quantitatively evaluated by video scanning measurement using the CREAM research software (Ver 4.1). Values of HSC70 (grey columns) and HSP68 (black columns) are relative amounts of pixel density given in percentage of the HSC70 value of unstressed, unprimed C6 cells (left ordinate) and are plotted against the recovery time. The fraction of cells in S phase is displayed as a line (right ordinate, see Figure 1 for other fractions). 0/t: primed C6 cells directly before the second heat shock. Values are means (±SE) of at least three independent experiments.
Figure 5
Figure 5
Western blot determination of HSC70 and HSP68 levels in synchronized C6 cells after serum stimulation and heat shock. C6 cells synchronized by serum starvation were serum stimulated (top panel) and heat shocked directly afterwards (middle and bottom panel). After the indicated times of serum stimulation cells were harvested and analysed by western blot. (a) Representative immunoblots using the SPA‐820 antibody that recognizes HSC70 and HSP68. (b) Western blots were quantitatively evaluated by video scanning measurement using the CREAM research software (Ver 4.1). Values of HSC70 (grey columns) and HSP68 (black columns) are relative amounts of pixel density given in percentage of the HSC70 value of unstressed, unprimed C6 cells and are plotted against the recovery time. The fraction of cells in S phase is displayed as a line (see Figure 2 for other fractions). 0/t: primed C6 cells directly before the second heat shock. Values are means (±SE) of at least three independent experiments.
Figure 5
Figure 5
Western blot determination of HSC70 and HSP68 levels in synchronized C6 cells after serum stimulation and heat shock. C6 cells synchronized by serum starvation were serum stimulated (top panel) and heat shocked directly afterwards (middle and bottom panel). After the indicated times of serum stimulation cells were harvested and analysed by western blot. (a) Representative immunoblots using the SPA‐820 antibody that recognizes HSC70 and HSP68. (b) Western blots were quantitatively evaluated by video scanning measurement using the CREAM research software (Ver 4.1). Values of HSC70 (grey columns) and HSP68 (black columns) are relative amounts of pixel density given in percentage of the HSC70 value of unstressed, unprimed C6 cells and are plotted against the recovery time. The fraction of cells in S phase is displayed as a line (see Figure 2 for other fractions). 0/t: primed C6 cells directly before the second heat shock. Values are means (±SE) of at least three independent experiments.

Similar articles

Cited by

References

    1. Beck SC, De Maio A.(1994). Stabilisation of protein synthesis in thermotolerant cells during heat shock. Association of heat shock protein‐72 with ribosomal subunits of polysomes. J. Biol. Chem. 269,21803–21811. - PubMed
    1. Benda P, Lightbody J, Sato G, Levine L, Sweet W.(1968). Differentiated rat glial cell strain in tissue culture. Science 161,370–371. - PubMed
    1. Cellier MFM, Taimi M, Chateau MT, Cannat A, Marti J.(1993). Thermal stress as an inducer of differentiation of U937 cells. Leukemia Res. 17,649–656. - PubMed
    1. Coss RA.(1986). Decay of thermal resistence following acute heating is independent of the G1‐ to S‐phase transition. Rad. Research 107,143–146. - PubMed
    1. De Maio A.(1999). Heat shock proteins: facts, thoughts and dreams. SHOCK 11,1–12. - PubMed

Substances