The importance of ERK activity in the regulation of cyclin D1 levels and DNA synthesis in human cultured airway smooth muscle
- PMID: 10960064
- PMCID: PMC1572283
- DOI: 10.1038/sj.bjp.0703454
The importance of ERK activity in the regulation of cyclin D1 levels and DNA synthesis in human cultured airway smooth muscle
Abstract
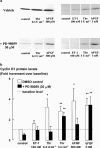
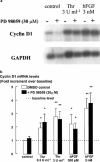
The relationship between persistent ERK (extracellular signal-regulated kinase) activity, cyclin D1 protein and mRNA levels and cell cycle progression in human cultured airway smooth muscle was examined in response to stimulation by ET-1 (endothelin-1), thrombin and bFGF (basic fibroblast growth factor). Thrombin (0.3 and 3 u ml(-1)) and bFGF (0.3 and 3 nM) increased ERK activity for more than 2 h and increased cell number, whereas ET-1 (100 nM) transiently stimulated ERK activity and was non-mitogenic. The MEK1 (mitogen-activated ERK kinase) inhibitor, PD 98059 (30 microM), inhibited both ERK phosphorylation and activity, and either prevented (thrombin 0.3 and 3 u ml(-1), bFGF 300 pM) or attenuated (bFGF 3 nM) DNA synthesis. Thrombin and bFGF increased both cyclin D1 mRNA and protein levels. PD 98059 decreased cyclin D1 protein levels stimulated by the lower but not higher thrombin concentrations. Moreover, increases in cyclin D1 mRNA levels were unaffected by PD 98059 pretreatment, irrespective of the mitogen or its concentration, suggesting that inhibition of cyclin D1 protein levels occurred by a post-transcriptional mechanism. These findings indicate that the control of cyclin D1 protein levels may occur independently of the MEK1/ERK signalling pathways. The inhibition of S phase entry by PD 98059 at higher thrombin concentrations appears to result from effects on pathways downstream or parallel to those regulating cyclin D1 protein levels. These findings suggest heterogeneity in the signalling of DNA synthesis in human cultured airway smooth muscle.
Figures


Similar articles
-
Contribution of the p38MAPK signalling pathway to proliferation in human cultured airway smooth muscle cells is mitogen-specific.Br J Pharmacol. 2004 Aug;142(7):1182-90. doi: 10.1038/sj.bjp.0705809. Epub 2004 Jul 12. Br J Pharmacol. 2004. PMID: 15249425 Free PMC article.
-
Glucocorticoids inhibit proliferation, cyclin D1 expression, and retinoblastoma protein phosphorylation, but not activity of the extracellular-regulated kinases in human cultured airway smooth muscle.Am J Respir Cell Mol Biol. 1999 Jul;21(1):77-88. doi: 10.1165/ajrcmb.21.1.3396. Am J Respir Cell Mol Biol. 1999. PMID: 10385595
-
Beta2-adrenergic receptor agonists and cAMP arrest human cultured airway smooth muscle cells in the G(1) phase of the cell cycle: role of proteasome degradation of cyclin D1.Mol Pharmacol. 1999 Nov;56(5):1079-86. doi: 10.1124/mol.56.5.1079. Mol Pharmacol. 1999. PMID: 10531416
-
Interleukin-1alpha and tumour necrosis factor-alpha modulate airway smooth muscle DNA synthesis by induction of cyclo-oxygenase-2: inhibition by dexamethasone and fluticasone propionate.Br J Pharmacol. 1999 Mar;126(6):1315-24. doi: 10.1038/sj.bjp.0702424. Br J Pharmacol. 1999. PMID: 10217524 Free PMC article.
-
Differential inhibition of thrombin- and EGF-stimulated human cultured airway smooth muscle proliferation by glucocorticoids.Pulm Pharmacol Ther. 2003;16(3):171-80. doi: 10.1016/S1094-5539(02)00183-9. Pulm Pharmacol Ther. 2003. PMID: 12749833
Cited by
-
Megakaryocyte polyploidy is inhibited by lysyl oxidase propeptide.Cell Cycle. 2013 Apr 15;12(8):1242-50. doi: 10.4161/cc.24312. Epub 2013 Mar 21. Cell Cycle. 2013. PMID: 23518500 Free PMC article.
-
Protease-activated receptor (PAR)-independent growth and pro-inflammatory actions of thrombin on human cultured airway smooth muscle.Br J Pharmacol. 2003 Mar;138(5):865-75. doi: 10.1038/sj.bjp.0705106. Br J Pharmacol. 2003. PMID: 12642388 Free PMC article.
-
Transcriptional regulation of cytokine function in airway smooth muscle cells.Pulm Pharmacol Ther. 2009 Oct;22(5):436-45. doi: 10.1016/j.pupt.2009.04.003. Epub 2009 Apr 22. Pulm Pharmacol Ther. 2009. PMID: 19393330 Free PMC article. Review.
-
Stimulus-dependent glucocorticoid-resistance of GM-CSF production in human cultured airway smooth muscle.Br J Pharmacol. 2005 May;145(1):123-31. doi: 10.1038/sj.bjp.0706174. Br J Pharmacol. 2005. PMID: 15735656 Free PMC article.
-
Hepatocyte proliferation/growth arrest balance in the liver of mice during E. multilocularis infection: a coordinated 3-stage course.PLoS One. 2012;7(1):e30127. doi: 10.1371/journal.pone.0030127. Epub 2012 Jan 10. PLoS One. 2012. PMID: 22253905 Free PMC article.
References
-
- ALBANESE C., JOHNSON J., WATANABE G., EKLUND N., VU D., ARNOLD A., PESTELL RG. Transforming p21ras mutants and c-Ets-2 activate the cyclin D1 promoter through distinguishable regions. J. Biol. Chem. 1995;270:23589–23597. - PubMed
-
- AVRUCH J. Insulin signal transduction through protein kinase cascades. Mol. Cell Biochem. 1998;182:31–48. - PubMed
-
- BALDIN V., LUKAS J., MARCOTE M.J., PAGANO M., DRAETTA G. Cyclin D1 is a nuclear protein required for cell cycle progression in G1. Genes Dev. 1993;7:812–821. - PubMed
-
- BORNFELDT K.E., CAMPBELL J.S., KOYAMA H., ARGAST G.M., LESLIE C.C., RAINES E.W., KREBS E.G., ROSS R. The mitogen-activated protein kinase pathway can mediate growth inhibition and proliferation in smooth muscle cells. Dependence on the availability of downstream targets. Br. J. Pharmacol. 1997;100:875–885. - PMC - PubMed
-
- BOULTON T.G., NYE S.H., ROBBINS D.J., IP N.Y., RADZIEJEWSKA E., MORGENBESSER S.D., DEPINHO R.A., PANAYOTATOS N., COBB M.H., YANCOPOULOS G.D. ERKs: a family of protein-serine/threonine kinases that are activated and tyrosine phosphorylated in response to insulin and NGF. Cell. 1991;65:663–675. - PubMed
Publication types
MeSH terms
Substances
Grants and funding
LinkOut - more resources
Full Text Sources
Research Materials
Miscellaneous

