

Multicolor FISH analysis of chromosomal breaks, duplications, deletions, and numerical abnormalities in the sperm of healthy men
- PMID: 10961911
- PMCID: PMC1287891
- DOI: 10.1086/303088
Multicolor FISH analysis of chromosomal breaks, duplications, deletions, and numerical abnormalities in the sperm of healthy men
Abstract
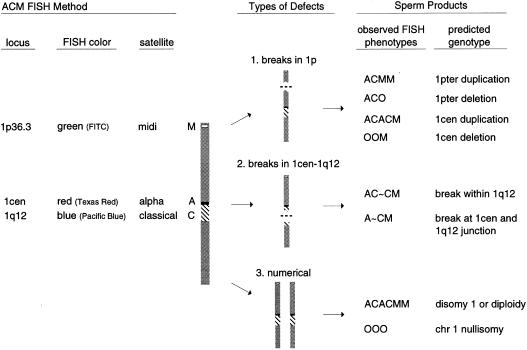
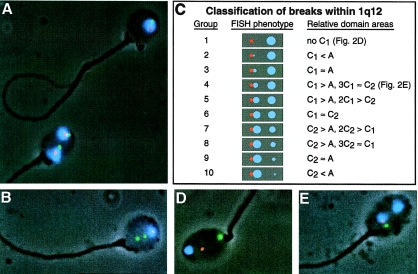
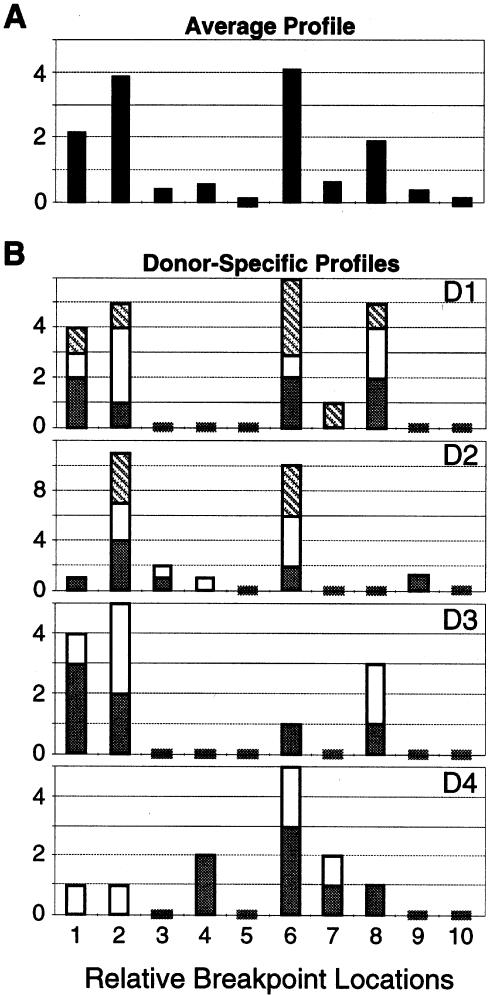
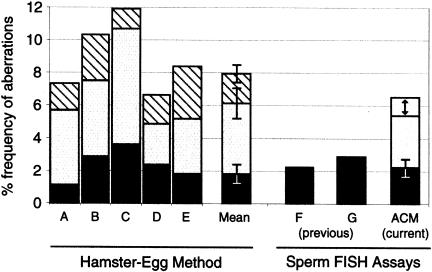
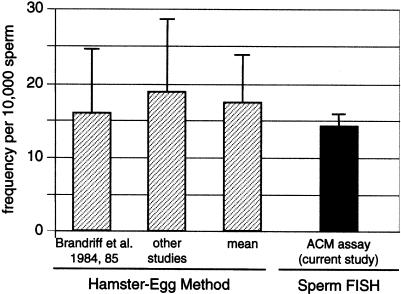
Transmitted de novo structural chromosomal abnormalities, the majority of which are paternally derived, can lead to abnormal reproductive outcomes as well as genetic diseases in offspring. We developed and validated a new multicolor FISH procedure (sperm ACM, which utilizes DNA probes specific for the alpha [1cen], classical, [1q12], and midi [1p36.3] satellites of chromosome 1) which utilizes DNA probes specific for three regions of chromosome 1 to detect human sperm that carry numerical abnormalities plus two categories of structural aberrations: (1) duplications and deletions of 1pter and 1cen, and (2) chromosomal breaks within the 1cen-1q12 region. In healthy men, the average frequencies of sperm with duplications and deletions were (a) 4.5 +/- 0.5 and 4.1 +/- 1.3 per 10(4) involving 1pter and (b) 0.9 +/- 0.4 and 0.8 +/- 0.3 per 10(4) involving 1cen, respectively. The frequency of sperm exhibiting breaks within the 1cen-1q12 region was 14.1 +/- 1.2 per 10(4). Structural aberrations accounted for 71% of the abnormalities detected by sperm ACM, which was significantly higher than numerical abnormalities (P=2x10⁻⁸). Our findings also suggest that, for healthy men, (a) sperm carrying postmeiotic chromosomal breaks appear to be more prevalent than those carrying products of premeiotic or meiotic breakage or rearrangements, (b) the high frequency of chromosome breaks measured after "fertilization" by the hamster-egg cytogenetic method already appear to be present and detectable within human sperm by FISH, and (c) there are nonrandom and donor-specific distributions of breakpoint locations within 1q12 in sperm. FISH facilitates the analysis of much larger numbers of sperm than was possible when the hamster-egg method was used. Therefore, FISH-based procedures for simultaneously detecting chromosomal breaks, rearrangements, and numerical abnormalities in sperm may have widespread applications in human genetics, genetic toxicology, and reproductive medicine.
Figures
Similar articles
-
Detection of structural and numerical chromosomal abnormalities by ACM-FISH analysis in sperm of oligozoospermic infertility patients.Hum Reprod. 2004 Jun;19(6):1395-400. doi: 10.1093/humrep/deh278. Epub 2004 Apr 29. Hum Reprod. 2004. PMID: 15117895
-
Simultaneous detection of structural and numerical chromosome abnormalities in sperm of healthy men by multicolor fluorescence in situ hybridization.Hum Genet. 1996 Nov;98(5):608-15. doi: 10.1007/s004390050268. Hum Genet. 1996. PMID: 8882884
-
A new FISH assay to simultaneously detect structural and numerical chromosomal abnormalities in mouse sperm.Mol Reprod Dev. 2003 Oct;66(2):172-80. doi: 10.1002/mrd.10299. Mol Reprod Dev. 2003. PMID: 12950105
-
Sperm and Oocyte Chromosomal Abnormalities.Biomolecules. 2023 Jun 17;13(6):1010. doi: 10.3390/biom13061010. Biomolecules. 2023. PMID: 37371589 Free PMC article. Review.
-
Analysis of structural and numerical chromosome abnormalities in sperm of normal men and carriers of constitutional chromosome aberrations. A review.Hum Genet. 1997 Jul;100(1):1-21. doi: 10.1007/s004390050459. Hum Genet. 1997. PMID: 9225963 Review.
Cited by
-
Occupational exposure to benzene and chromosomal structural aberrations in the sperm of Chinese men.Environ Health Perspect. 2012 Feb;120(2):229-34. doi: 10.1289/ehp.1103921. Epub 2011 Nov 15. Environ Health Perspect. 2012. PMID: 22086566 Free PMC article.
-
Increased frequency of aneuploidy in long-lived spermatozoa.PLoS One. 2014 Dec 9;9(12):e114600. doi: 10.1371/journal.pone.0114600. eCollection 2014. PLoS One. 2014. PMID: 25490252 Free PMC article.
-
Stable variants of sperm aneuploidy among healthy men show associations between germinal and somatic aneuploidy.Am J Hum Genet. 2002 Jun;70(6):1507-19. doi: 10.1086/340791. Epub 2002 Apr 30. Am J Hum Genet. 2002. PMID: 11992257 Free PMC article.
-
Advanced age increases chromosome structural abnormalities in human spermatozoa.Eur J Hum Genet. 2011 Feb;19(2):145-51. doi: 10.1038/ejhg.2010.166. Epub 2010 Nov 3. Eur J Hum Genet. 2011. PMID: 21045871 Free PMC article.
-
An occupational reproductive research agenda for the third millennium.Environ Health Perspect. 2003 Apr;111(4):584-92. doi: 10.1289/ehp.5548. Environ Health Perspect. 2003. PMID: 12676620 Free PMC article.
References
-
- Adler ID, Reitmeir P, Schmoller R, Schriever-Schwemmer G (1994) Dose response for heritable translocations induced by acrylamide in spermatids of mice. Mutat Res 309:285–291 - PubMed
-
- Aula P, von Koskull H (1976) Distribution of spontaneous chromosome breaks in human chromosomes. Hum Genet 32:143–148 - PubMed
-
- Aymé S, Mattei J, Mattei M, Aurran Y, Giraud F (1976) Nonrandom distribution of chromosome breaks in cultured lymphocytes of normal subjects. Hum Genet 31:161–175 - PubMed
-
- Barrios L, Miro R, Caballin M, Fuster C, Guedea F, Subias A, Egozcue J (1989) Cytogenetic effects of radiotherapy: breakpoint distribution in induced chromosome aberrations. Cancer Genet Cytogenet 41:61–70 - PubMed
Publication types
MeSH terms
Grants and funding
LinkOut - more resources
Full Text Sources
