. 2000 Sep;116(3):363-78.
doi: 10.1085/jgp.116.3.363.

The molecular basis for Na-dependent phosphate transport in human erythrocytes and K562 cells

Affiliations

The molecular basis for Na-dependent phosphate transport in human erythrocytes and K562 cells

R T Timmer et al. J Gen Physiol. 2000 Sep.

Abstract

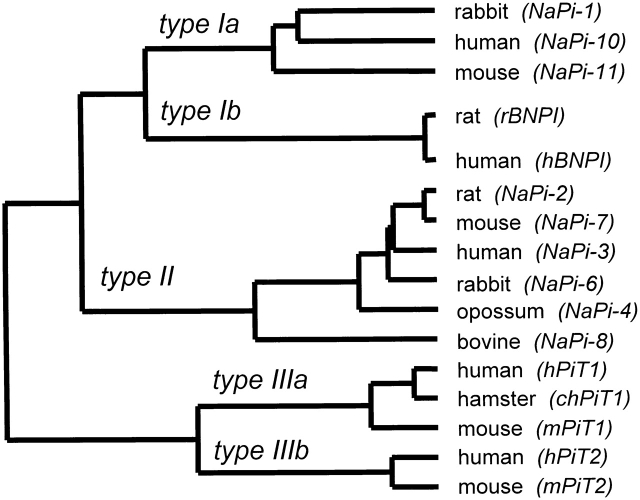
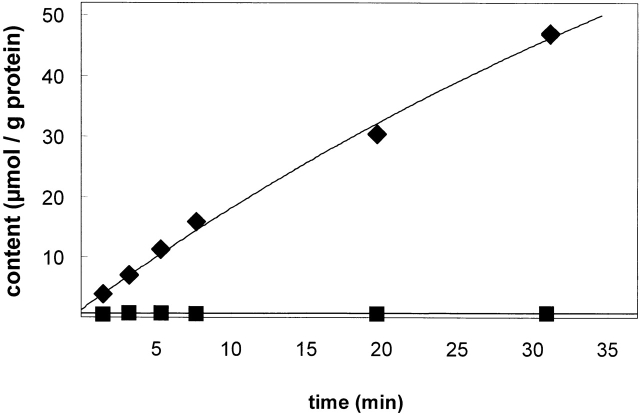
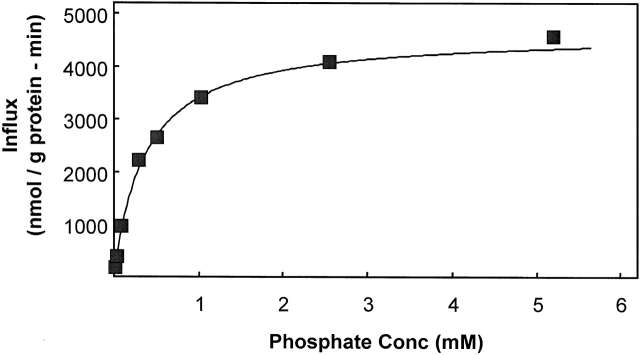
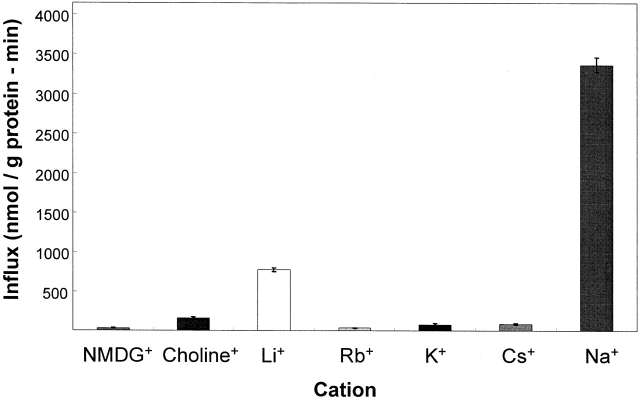
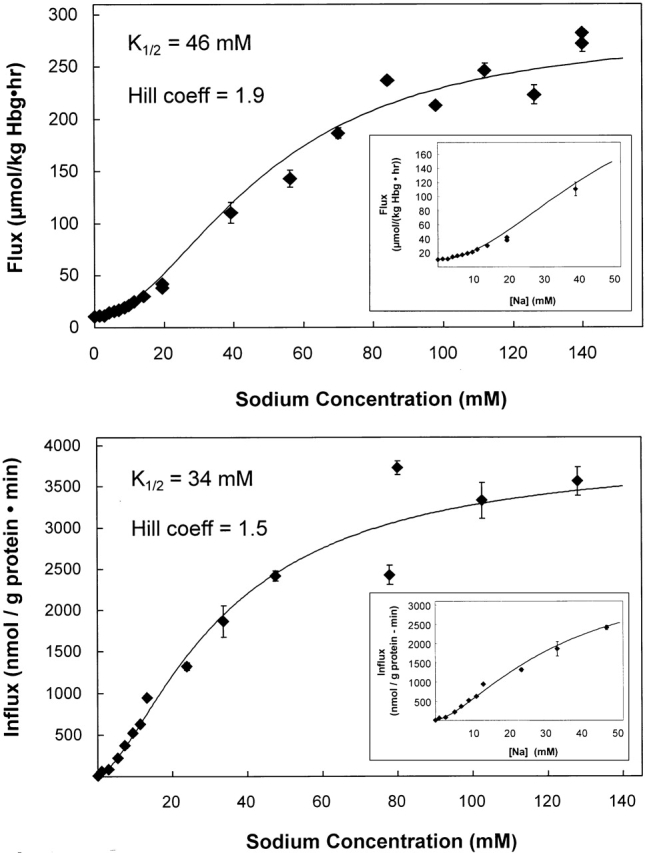
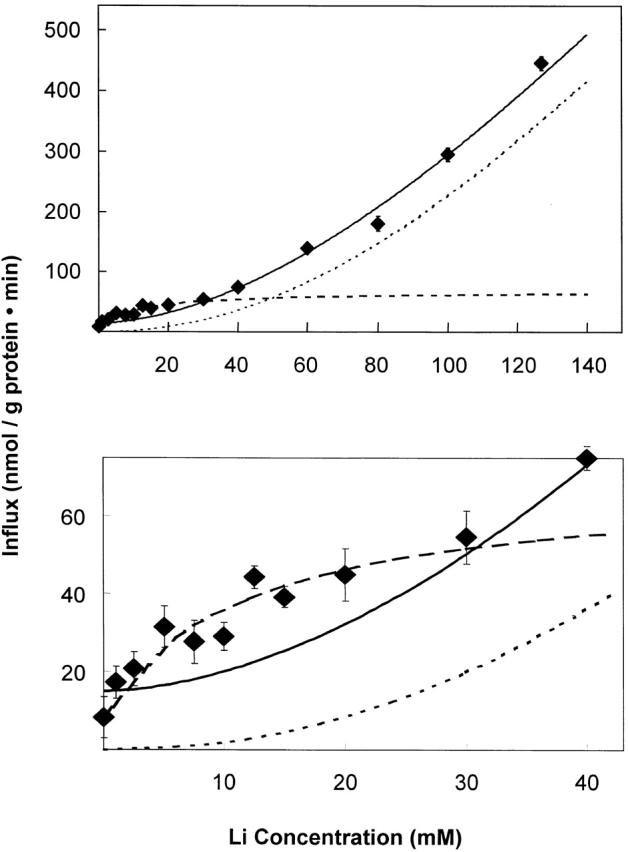
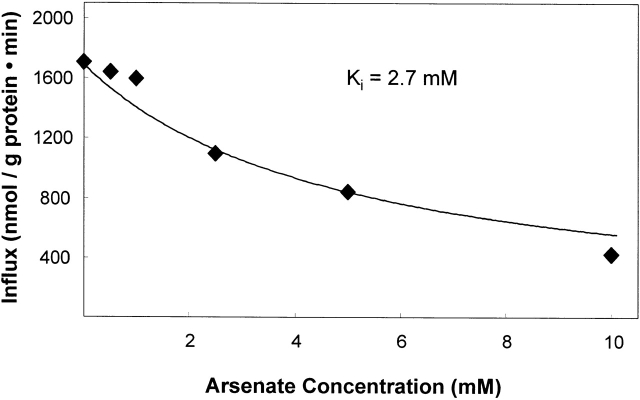
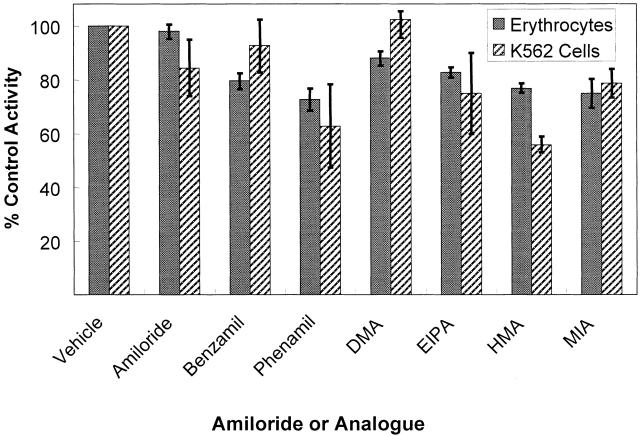
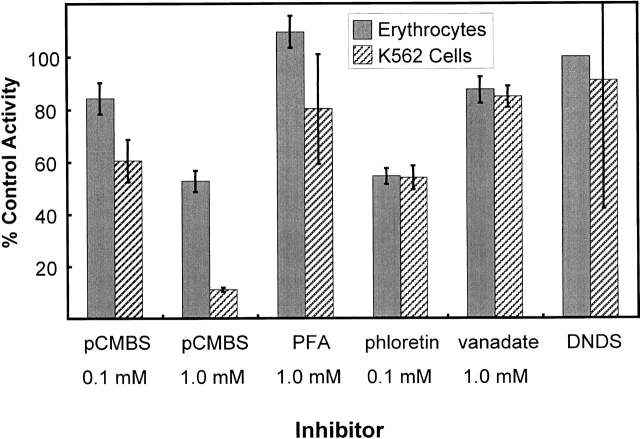
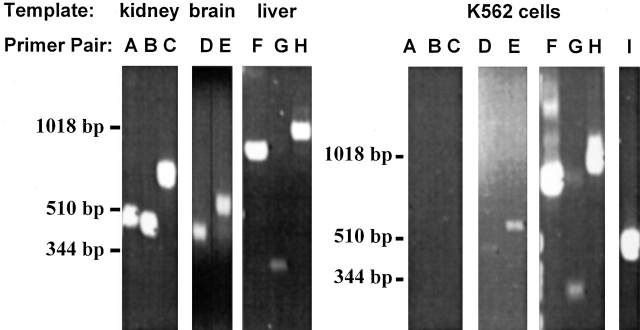
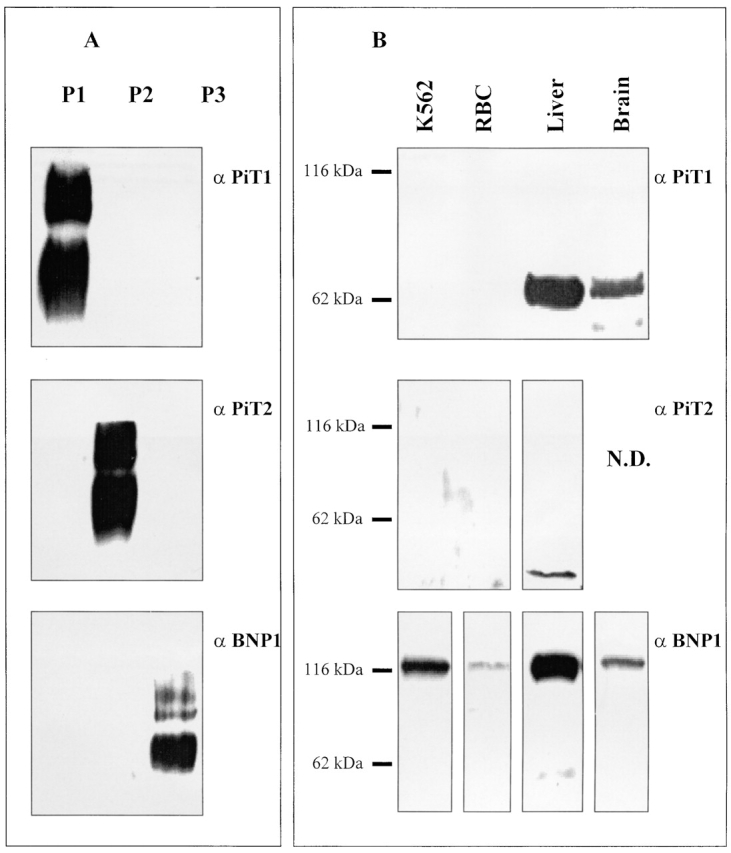
The kinetics of sodium-stimulated phosphate flux and phosphate-stimulated sodium flux in human red cells have been previously described (Shoemaker, D.G., C.A. Bender, and R.B. Gunn. 1988. J. Gen. Physiol. 92:449-474). However, despite the identification of multiple isoforms in three gene families (Timmer, R.T., and R.B. Gunn. 1998. Am. J. Physiol. Cell Physiol. 274:C757-C769), the molecular basis for the sodium-phosphate cotransporter in erythrocytes is unknown. Most cells express multiple isoforms, thus disallowing explication of isoform-specific kinetics and function. We have found that erythrocyte membranes express one dominant isoform, hBNP-1, to which the kinetics can thus be ascribed. In addition, because the erythrocyte Na-PO(4) cotransporter can also mediate Li-PO(4) cotransport, it has been suggested that this transporter functions as the erythrocyte Na-Li exchanger whose activity is systematically altered in patients with bipolar disease and patients with essential hypertension. To determine the molecular basis for the sodium-phosphate cotransporter, we reasoned that if the kinetics of phosphate transport in a nucleated erythroid-like cell paralleled those of the Na-activated pathway in anucleated erythrocytes and yet were distinct from those known for other Na-PO(4) cotransporters, then the expressed genes may be the same in both cell types. In this study, we show that the kinetics of sodium phosphate cotransport were similar in anuclear human erythrocytes and K562 cells, a human erythroleukemic cell line. Although the erythrocyte fluxes were 750-fold smaller, the half-activation concentrations for phosphate and sodium and the relative cation specificities for activation of (32)PO(4) influx were similar. Na-activation curves for both cell types showed cooperativity consistent with the reported stoichiometry of more than one Na cotransported per PO(4). In K562 cells, external lithium activation of phosphate influx was also cooperative. Inhibition by arsenate, K(I) = 2.6-2.7 mM, and relative inhibition by amiloride, amiloride analogs, phosphonoformate, and phloretin were similar. These characteristics were different from those reported for hNaPi-3 and hPiT-1 in other systems. PCR analysis of sodium-phosphate cotransporter isoforms in K562 cells demonstrated the presence of mRNAs for hPiT-1, hPiT-2, and hBNP-1. The mRNAs for hNaPi-10 and hNaPi-3, the other two known isoforms, were absent. Western analysis of erythrocytes and K562 cells with isoform-specific antibodies detected the presence of only hBNP-1, an isoform expressed in brain neurons and glia. The similarities in the kinetics and the expression of only hBNP-1 protein in the two cell types is strong evidence that hBNP-1 is the erythrocyte and K562 cell sodium-phosphate cotransporter.


Figures

Figure 1
Figure 1
Dendrogram showing the three major families of Na-phosphate cotransporters identified in mammalian cells. The multiple sequence alignment was carried out using ClustalX on the derived amino acid sequences for the indicated isoforms (protein weight matrix used was Dayhoff PAM 250; gap penalty, 10; and floating gap penalty, 10; see Thompson et al. 1994). The dendrogram was constructed from the dendrogram output file of ClustalX. The commonly used designation for the given isoform is given in parentheses next to the species type from which the cDNA was isolated. The corresponding gene names for these isoforms as designated by the Human Gene Nomenclature Committee (HGNC) are as follows: (a) SLC17A1 for NaPi-10; (b) SLC20A1 for hPiT1; (c) SLCS20A2 for hPiT2; and (d) SLC34A1 for NaPi-3. There is no name designated by HGNC for hBNP-1.
Figure 2
Figure 2
Typical time course of phosphate influx in K562 cells in the presence and absence of Nao. Time course of traced phosphate content into K562 cells. (Top) 32PO4 influx into K562 cells in 128 mM NaCl medium. (Bottom) 32PO4 influx into K562 cells in the absence of Na (150 N-methyl-d-glucamine medium), pH 7.4, 37ºC, 0.3 mM PO4. The cell content of traced phosphate as a function of time was a single exponential y(t) − y o = (y y o) · (1 − e kt) where y o is the extrapolated initial traced content, y is the steady state traced content, and the initial slope of the curve is the influx: (y y o) · (k) = 1,800 ± 570 nmol/(g protein · min). Duplicate values are obscured by the symbols.
Figure 3
Figure 3
Determination of the K 1/2 for phosphate activation of 32PO4 influx. Extracellular phosphate activation of 32PO4 flux into K562 cells at Naout = 130 mM. The data were fit to the Michaelis-Menten equation, v = Vmax · [PO4]out/(K 1/2 + [PO4]out), by nonlinear least squares. For the data shown, Vmax = 4,630 nmol PO4/(g protein · min) and K 1/2 = 0.36 mM. The phosphate influx was almost entirely Na dependent: the flux carried out at 0.3 mM PO4 in the absence of Na+ was only ∼75 nmol PO4/(g protein · min). Each point is a single flux calculated from the time course of six values at the given extracellular phosphate concentration. One of five similar experiments.
Figure 4
Figure 4
Activation of 32PO4 influx by monovalent cations in erythrocytes and K562 cells. Monovalent cation activation of 32PO4 influx in the presence of 1.0 mM external phosphate, pH 7.4, 37ºC, and fluxes were carried out as described with each indicated cation present at 143 mM using the chloride salt. The standard errors of six determinations in one of four similar experiments.
Figure 5
Figure 5
Determination of the K 1/2 for sodium activation of 32PO4 influx. Sodium activation of 32PO4 flux into erythrocytes (top) and K562 cells (bottom) was determined. In these experiments, the total phosphate concentration was 0.3 mM. Both curves appear sigmoidal, although the data from K562 cells is equally well fit by a single site (Michaelis-Menten) equation. Using the Hill equation, the concentration of sodium required for half maximal activation of phosphate influx was 46 mM for erythrocytes and 34 mM for K562 cells. The extrapolated maximum flux was 277 μmol/[kg hemoglobin (Hgb) · h] in erythrocytes and 3,900 nmol/(g protein · min) in K562 cells. The Hill coefficient, N, was 1.9 for erythrocytes and 1.5 for K562 cells. When the Michaelis-Menten equation was used to fit the data from K562 cells, the Vmax was 6,000 nmol/(g protein · min) and K 1/2 = 80 mM.
Figure 6
Figure 6
Determination of the K 1/2 for lithium activation of 32PO4 influx in K562 cells. In these experiments, the total external phosphate concentration was 0.3 mM. When the data over the entire concentration range (0–143.5 mM Li+) are fit to the Hill equation (top and bottom, solid line), the activation was cooperative with K 1/2 Li = 430 mM and Hill coefficient, N = 1.7 for the best fit line as shown assuming Vmax = 3,900 nmol PO4/(g protein · min). However, when the data at low lithium concentration (0–30 mM) are fit to the Hill equation (bottom, dashed line), the activation was not cooperative with K 1/2 Li = 7 mM and Hill coefficient, N = 1.0 for the best fit line, as shown assuming Vmax = 90 nmol PO4/(g protein · min). When the values from this line are subtracted from the original data, and the resulting values fit to the Hill equation (top and bottom, dotted line), the activation was cooperative with K 1/2 Li = 270 mM and Hill coefficient, N = 2.1 for the best fit line as shown assuming Vmax = 2,100 nmol PO4/(g protein · min). It appears that the activation of 32PO4 influx has two components: a hyperbolic component with a Hill coefficient of 1 (cotransport of 1 Li+ and 1 PO4) and a sigmoidal component with a Hill coefficient of 2 (cotransport of two Li+ and one PO4).
Figure 7
Figure 7
Determination of the K I for arsenate inhibition of the sodium-activated 32PO4 influx in K562 cells. The data were fit to the equation for a competitive inhibitor: influx = Vmax · [PO4]/{K 1/2 · (1 + [arsenate]/K i + [PO4])} by varying K i. The constants were used from Fig. 2: Vmax = 3,712, K 1/2 = 0.36 mM, [PO4] = 0.3 mM. The K i value is 2.7 mM. The error bars are obscured by the symbols.
Figure 8
Figure 8
Comparison of the sensitivity of erythrocytes and K562 cells to inhibition by amiloride and its analogs. The flux assays were carried out as described, except that the media contained 0.3 mM total phosphate and 32.5 mM DMSO. The control (100%) flux values for erythrocytes were 0.26–0.30 mmol PO4/kg Hgb · h in different experiments. The control flux values for K562 cells were 850–960 nmol/g protein · min. The standard deviation of two to four determinations is shown by the error bars. Each of the indicated compounds was used at 0.1 mM final concentration. The compounds used are indicated using their abbreviated names, which are used for the following chemical names: Phenamil is phenamil methanesulfonate; DMA is 5-(N,N-dimethyl)-amiloride; EIPA is 5-(N-ethyl-N-isopropyl)-amiloride; HMA is 5-(N,N-hexamethylene)-amiloride; and, MIA is 5-(N-methyl-N-isobutyl)-amiloride.
Figure 9
Figure 9
Pharmacology of inhibition of phosphate influx in erythrocytes and K562 cells. Various compounds were tested for their ability to inhibit the Na-dependent phosphate influx in human erythrocytes (shaded bars) or K562 cells (cross-hatched bars). All erythrocyte suspensions also contained 0.25 mM DNDS to block AE1. The control (100%) flux values for erythrocytes were 0.20–0.41 mmol PO4/kg Hgb · h in different experiments. The control flux values for K562 cells were 750–1,940 nmol/g protein · min. The standard deviation of two to four measurements is shown by the error bars. Each of the indicated compounds was used at the indicated concentrations. The following compounds were tested: pCMBS, PFA, phloretin, sodium vanadate (vanadate), and DNDS.
Figure 10
Figure 10
Expression of sodium-phosphate cotransporter isoforms in human tissues and K562 cells as determined by PCR. cDNA was obtained from CLONTECH Laboratories, Inc. for several human tissues, including kidney, brain, liver, and K562 cells. The templates used for the given various PCR primers are indicated above the gel image. Primer pairs specific for the various sodium-phosphate cotransporter isoforms or GAPDH are indicated above the gel image. The primer pairs and their expected products were as follows (see Table for description): (A) NaPi-3 (479 bp), (B) NaPi-10 (459 bp), (C) NaPi-10 (705 bp), (D) hBNP-1 (466 bp), (E) hBNP-1 (576 bp), (F) hPiT-1 (825 bp), (G) hPiT-1 (310 bp), (H) hPiT-2 (935 bp), and (I) GAPDH (452 bp).
Figure 11
Figure 11
Expression of sodium-phosphate cotransporter isoforms in human tissues and K562 cells as determined by Western analysis. (A) The specificity of the antibodies for the antigenic peptides was tested by Western analysis of BSA-peptide conjugates. The lanes are labeled as follows: P1 (BSA-PiT-1 peptide conjugate), P2 (BSA-PiT-2 peptide conjugate), and P3 (BSA-BNP-1 peptide conjugate). Each lane was loaded with 1 ng of total BSA-peptide conjugate. The blot in α PiT-1 shows reactivity of these BSA-peptide conjugates with the anti–PiT-1 polyclonal antibody prepared using a KLH-PiT-1 peptide conjugate. The other blots were developed using the anti-PiT-2 polyclonal antibody (α PiT-2) or the anti–BNP-1 polyclonal antibody (α BNP-1). The antibody dilution of the primary antibody used in all cases was 1/1,000 of the crude sera. (B) Whole cell lysates were prepared from rat tissues, K562 cells and human erythrocytes as described in materials and methods. Total cell protein from these samples were used for Western analysis. The samples are indicated at the top and are as follows (left to right): K562, which is K562 total cell protein (10 μg); RBC, which is total human erythrocyte protein (10 μg); liver, which is total rat liver protein (10 μg); and brain, which is total rat brain protein (10 μg). The blots were developed using the indicated polyclonal antibodies: α PiT-1, the anti–PiT-1 polyclonal antibody; α PiT-2, the anti–PiT-2 polyclonal antibody; and α BNP-1, the anti–BNP-1 polyclonal antibody.

Similar articles

Cited by

References

    1. Adragna N.C., Canessa M.L., Solomon H., Slater E., Tosteson D.C. Red cell lithium-sodium countertransport and sodium–potassium cotransport in patients with essential hypertension. Hypertension (Dallas). 1982;4:795–804. - PubMed
    1. Azzarolo A.M., Ritchie G., Quamme G. Inhibition of sodium-phosphate cotransport in renal brush-border membranes with the stilbenedisulfonate, H2-DIDS. Biochim. Biophys. Acta. 1991;1069:70–76. - PubMed
    1. Bairoch A., Bucher P., Hofmann K. The PROSITE database, its status in 1997. Nucleic Acids Res. 1997;25:217–221. - PMC - PubMed
    1. Berner W., Kinne R., Murer H. Phosphate transport into brush-border membrane vesicles isolated from rat small intestine. Biochem. J. 1976;160:467–474. - PMC - PubMed
    1. Canessa M., Adragna N., Solomon H.S., Connolly T.M., Tosteson D.C. Increased sodium–lithium countertransport in red cells of patients with essential hypertension. N. Engl. J. Med. 1980;302:772–776. - PubMed

Publication types

MeSH terms