. 2000 Sep;116(3):411-32.
doi: 10.1085/jgp.116.3.411.

Role of the beta1 subunit in large-conductance Ca(2+)-activated K(+) channel gating energetics. Mechanisms of enhanced Ca(2+) sensitivity

Affiliations

Role of the beta1 subunit in large-conductance Ca(2+)-activated K(+) channel gating energetics. Mechanisms of enhanced Ca(2+) sensitivity

D H Cox et al. J Gen Physiol. 2000 Sep.

Abstract

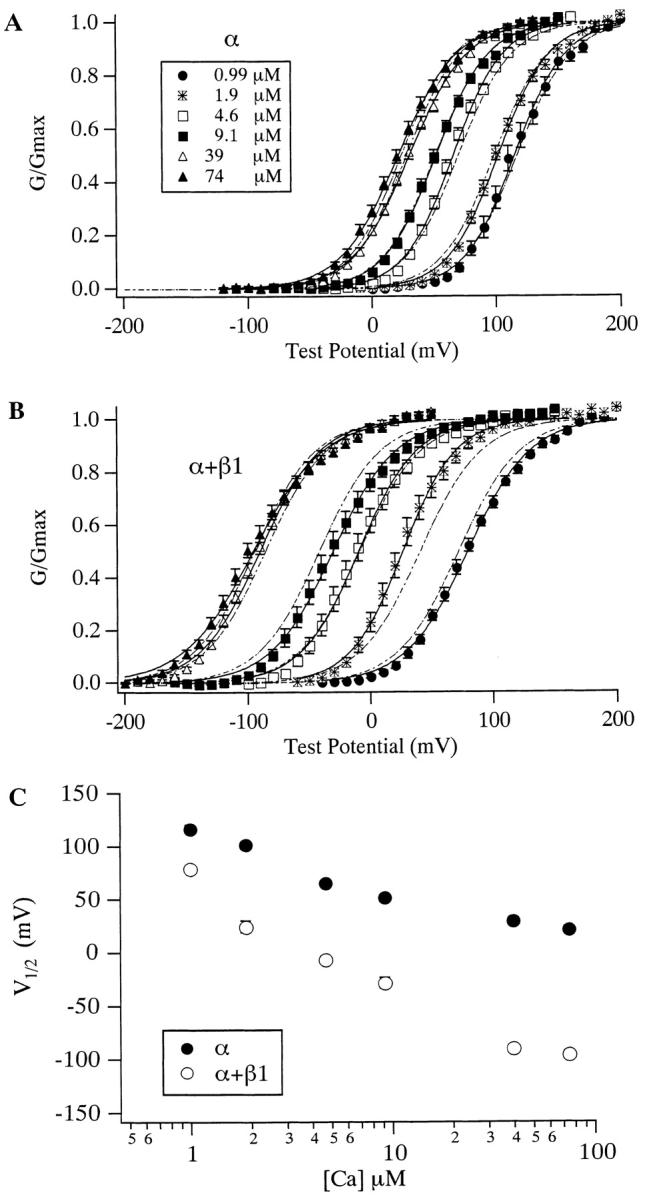
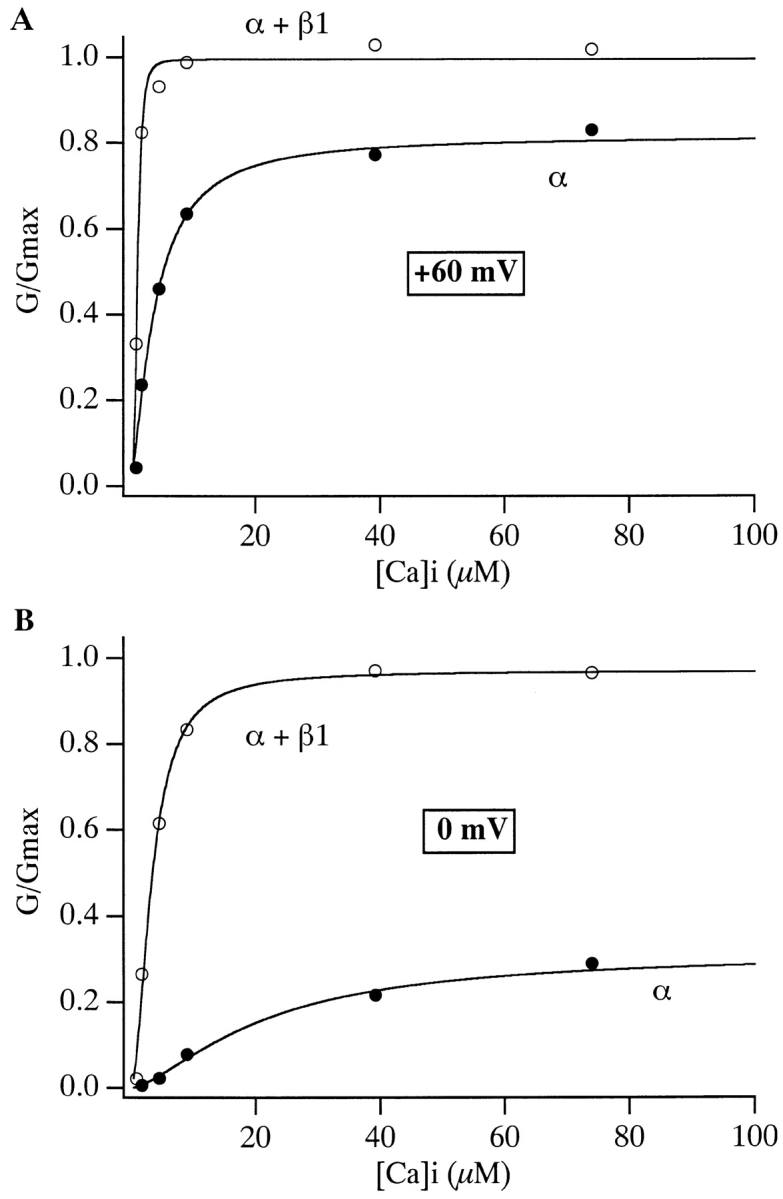
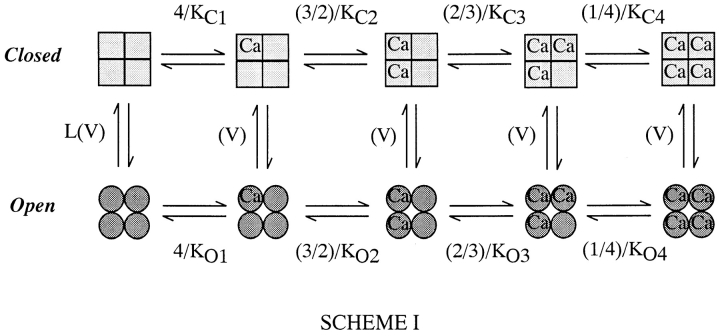
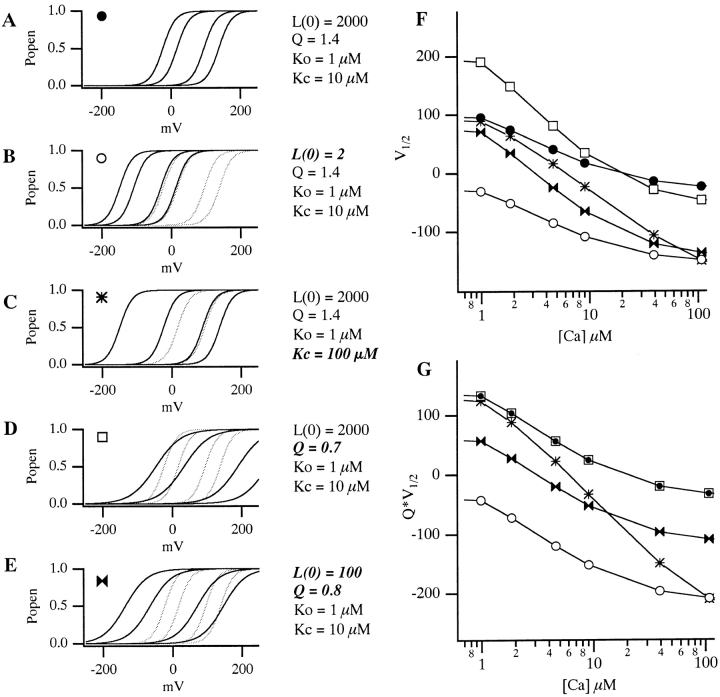
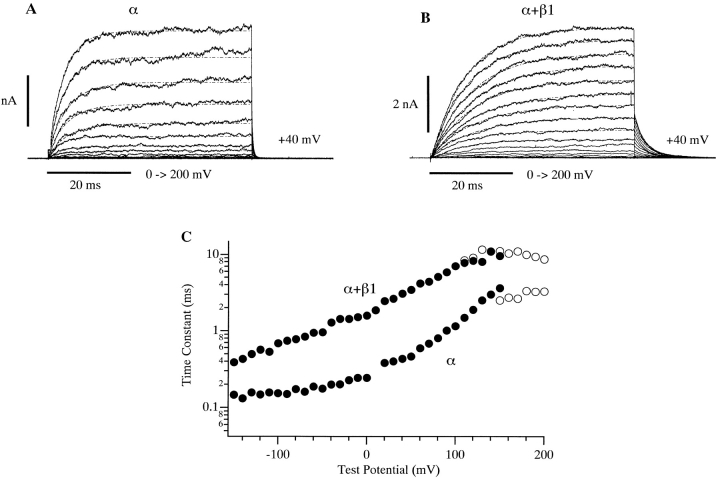
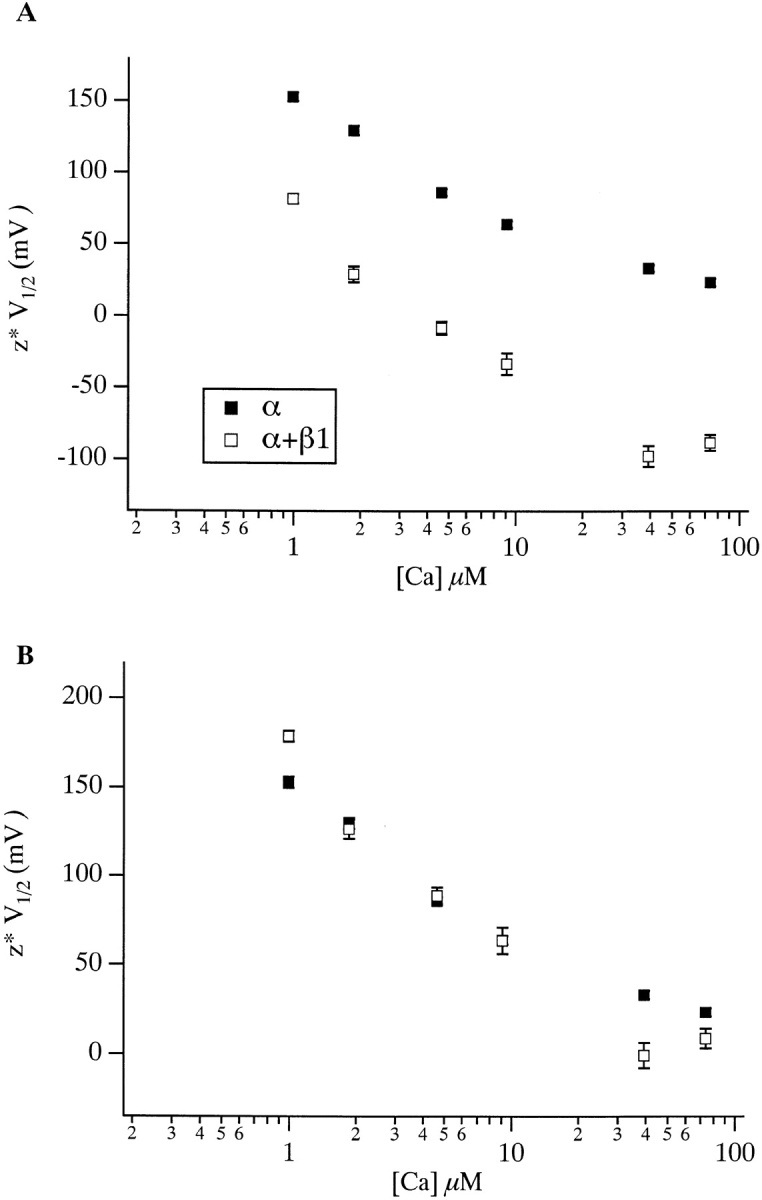
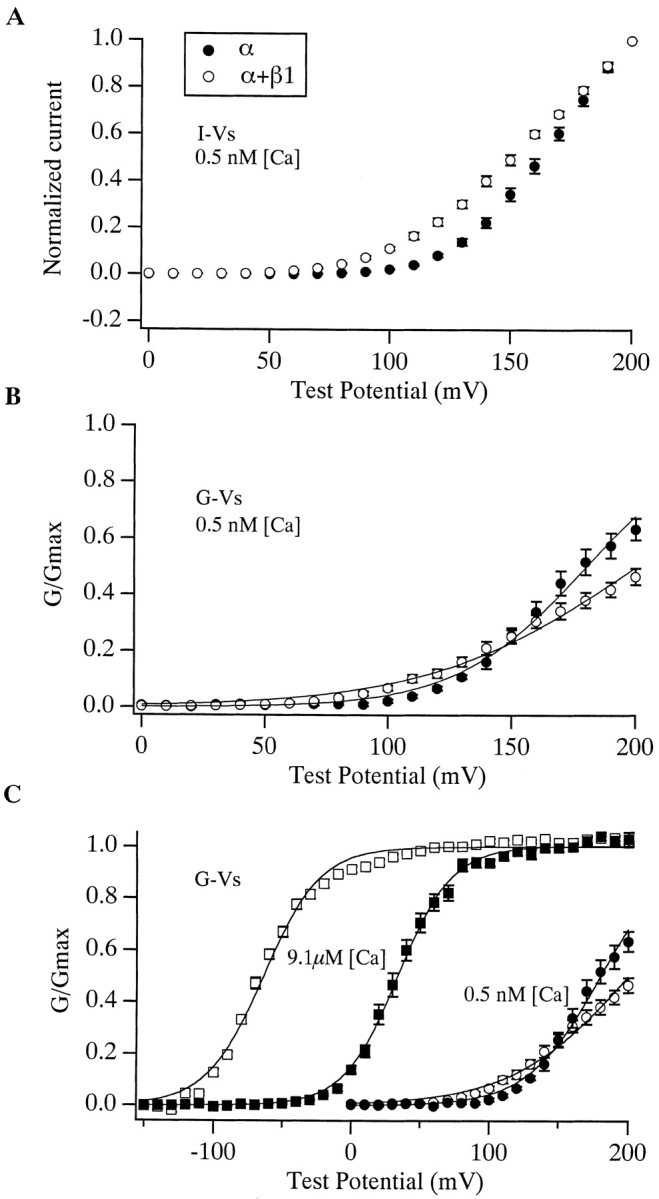
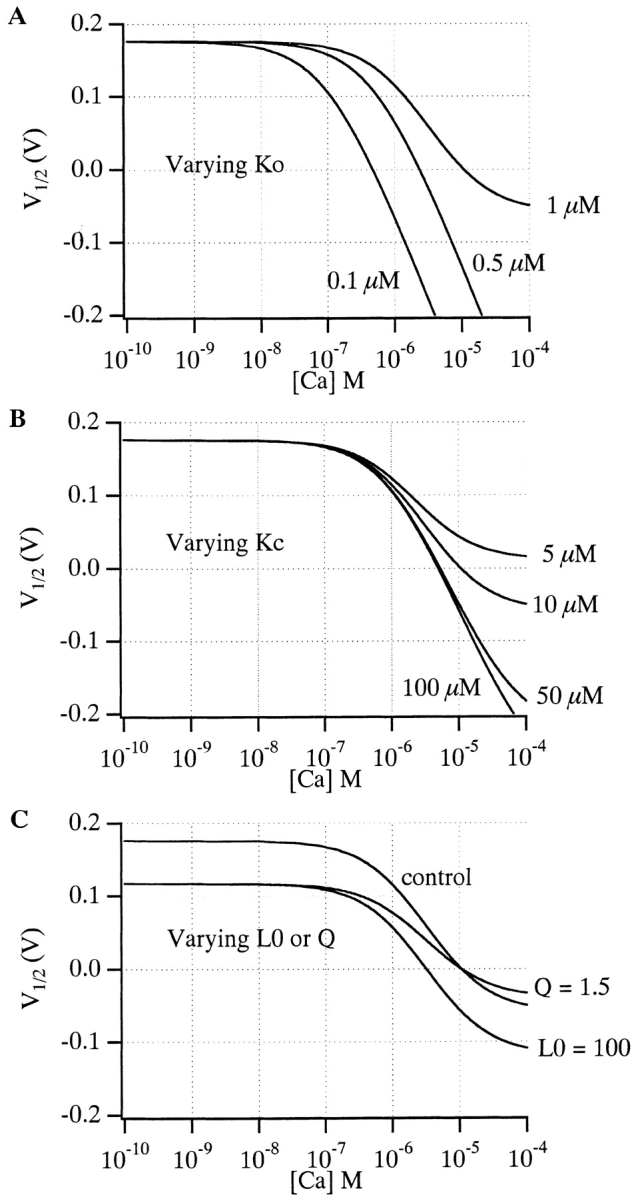
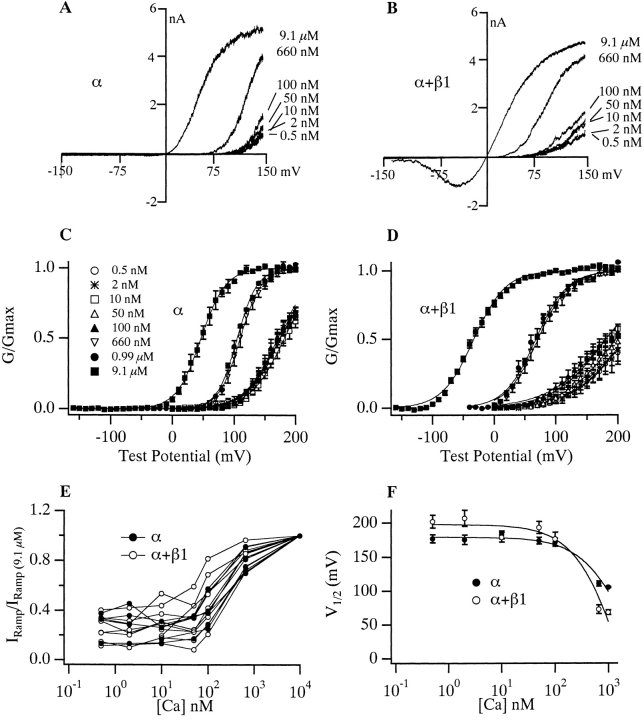
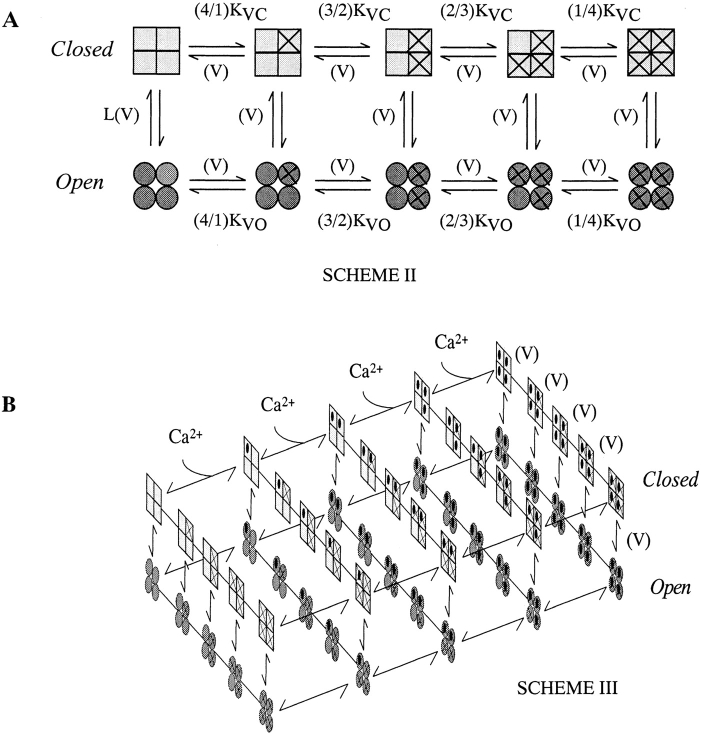
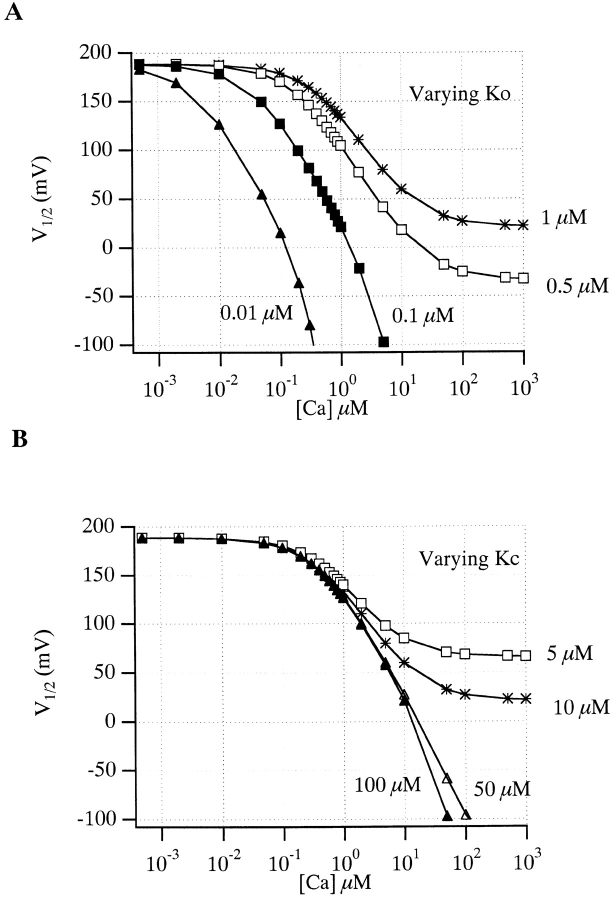
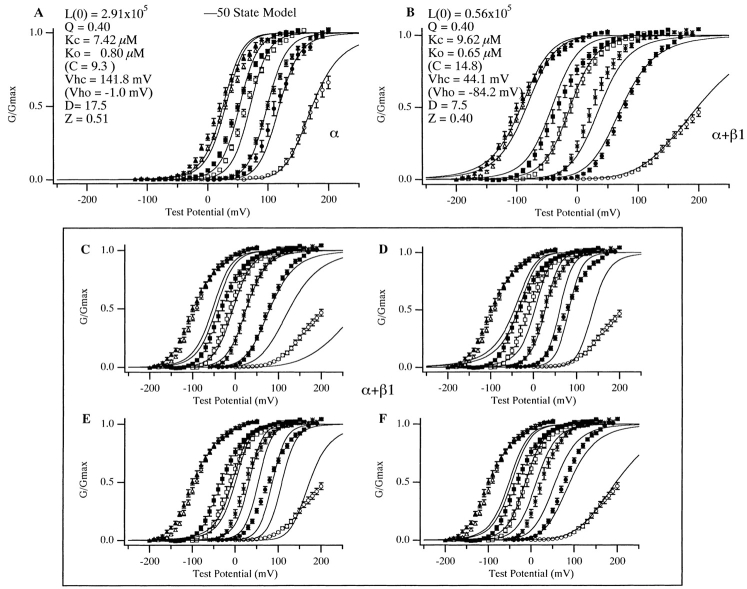
Over the past few years, it has become clear that an important mechanism by which large-conductance Ca(2+)-activated K(+) channel (BK(Ca)) activity is regulated is the tissue-specific expression of auxiliary beta subunits. The first of these to be identified, beta1, is expressed predominately in smooth muscle and causes dramatic effects, increasing the apparent affinity of the channel for Ca(2+) 10-fold at 0 mV, and shifting the range of voltages over which the channel activates -80 mV at 9.1 microM Ca(2+). With this study, we address the question: which aspects of BK(Ca) gating are altered by beta1 to bring about these effects: Ca(2+) binding, voltage sensing, or the intrinsic energetics of channel opening? The approach we have taken is to express the beta1 subunit together with the BK(Ca) alpha subunit in Xenopus oocytes, and then to compare beta1's steady state effects over a wide range of Ca(2+) concentrations and membrane voltages to those predicted by allosteric models whose parameters have been altered to mimic changes in the aspects of gating listed above. The results of our analysis suggest that much of beta1's steady state effects can be accounted for by a reduction in the intrinsic energy the channel must overcome to open and a decrease in its voltage sensitivity, with little change in the affinity of the channel for Ca(2+) when it is either open or closed. Interestingly, however, the small changes in Ca(2+) binding affinity suggested by our analysis (K(c) 7.4 microM --> 9.6 microM; K(o) = 0.80 microM --> 0.65 microM) do appear to be functionally important. We also show that beta1 affects the mSlo conductance-voltage relation in the essential absence of Ca(2+), shifting it +20 mV and reducing its apparent gating charge 38%, and we develop methods for distinguishing between alterations in Ca(2+) binding and other aspects of BK(Ca) channel gating that may be of general use.


Figures

Figure 1
Figure 1
The effects of Ca2+ on the mSlo G-V relation with and without the β1 subunit. G-V relations determined without (A) and with (B) β1 coexpression. [Ca2+] are as indicated in A. Each curve represents the average of between 6 and 15 experiments, as indicated in Table . Error bars represent SEM. Solid curves represent fits to the Boltzmann function G G max=11+e zFV12−VRT.Parameters of the fits are as follows, in order of increasing [Ca2+]. mSloα V1/2 (mV) = 115.0, 101.9, 65.7, 51.8, 30.4, and 21.2; z = 1.25, 1.25, 1.27, 1.20, 1.10, and 1.09. mSloα + β 1 V1/2 (mV) = 79.2, 26.4, −9.6, −30.6, −90.1, and −95.6; z = 1.01, 1.18, 1.08, 0.99, 1.04, and 0.90. Dashed curves represent fits to . Fit parameters are as follows: mSloα L(0) = 1,263, Q = 1.18, K C = 6.00 μM, K O = 1.24 μM; mSloα + β1 L(0) 281, Q = 1.02, K C = 9.82 μM, K O = 0.82 μM. (C) Plots of V1/2 vs. [Ca2+] for mSloα (•) and mSloα + β1 (○) channels. Data are from Table . Error bars indicate SEM and are often smaller than the plot symbols.
Figure 2
Figure 2
Ca2+ dose–response curves for mSloα (•) and mSloα + β1 (○) at (A) +60 mV and (B) 0 mV. Data are from those shown in Fig. 1A and Fig. B. Smooth curves represent fits to the Hill equation G/G max = Amplitude/{1 + (K d/[Ca])n}. Fit parameters are as follows: +60 mV mSloα K d = 3.84 μM, n = 1.5, Amplitude = 0.82; mSloα + β1 K d = 1.20 μM, n = 3.5, Amplitude = 1.00: 0 mV mSloα K d = 32.8 μM, n = 1.3, Amplitude = 0.39; mSloα + β1 K d = 3.43 μM, n = 1.9, Amplitude = 0.97.
Figure 3
Figure 3
Scheme I, two-tiered gating scheme. Those states in the top tier are designated closed. Those in the bottom tier are designated open. The central conformational change is voltage dependent with gating charge Q, and equilibrium constant L(0) = [closed]/[open]. KC1, KC2, KC3, and KC4 represent Ca2+ dissociation constants in the closed conformation. KO1, KO2, KO3, and KO4 represent Ca2+ dissociation constants in the open conformation. When KC1 = KC2 = KC3 = KC4 and KO1 = KO2 = KO3 = KO4, Scheme I represents a voltage-dependent version of the Monod-Wyman-Changeux model of allosteric proteins (Monod et al. 1965).
Figure 4
Figure 4
Effects of changes in various aspects of gating according to the voltage-dependent MWC model. (A) Control G-V simulations, with (from left to right) 0, 1, 10, and 100 μM [Ca2+]. Model parameters are as indicated. (B) Simulated effect of decreasing L(0). (C) Simulated effect of decreasing K C. (D) Simulated effect of decreasing Q. (E) Simulated effect of decreasing both Q and L(0). In A–E, the control curves of A are shown in gray for comparison. (F) Simulated V1/2 vs. [Ca2+] and (G) Q*V1/2 vs. [Ca2+] plots for the various conditions shown in A–E. Symbols are as indicated in A–E. Notice in G that only when the actual affinity of the model for Ca2+ is altered does the Q*V1/2 vs. [Ca2+] plot change shape.
Figure 6
Figure 6
The β1 subunit has effects on mSlo macroscopic current kinetics at subnanomolar [Ca2+]. Shown are families of current traces recorded in the absence (A) and presence (B) of β1. For each trace, the membrane voltage was held at −50 mV and stepped to the indicated voltages. [Ca2+] equaled 0.5 nM. Superimposed on each trace are monoexponential fits. Time constants from these fits are plotted in C (○). Also plotted are deactivation time constants (•) determined from monoexponential fits to currents elicited with a protocol that activated the channels with a depolarizing step, and then deactivated with steps to the indicated potentials (traces not shown).
Figure 5
Figure 5
(A) z*V1/2 vs. [Ca2+] plots for mSloα (▪) and mSloα + β1 (□). Each point represents the product of z and V1/2 values listed in Table . In B, the mSloα + β1 curve has been shifted vertically so that the two curves overlap at 9.1 μM. Errors bars indicate SEM and are often smaller than the plot symbols.
Figure 7
Figure 7
Effects of the β1 subunit at subnanomolar [Ca2+]. (A) Current–voltage curves for mSloα (•, n = 11) and mSloα + β1 (○, n = 8) determined from patches superfused with a solution buffered to 0.5 nM [Ca2+]. Each current measurement was made at the end of a 50-ms voltage step to the indicated test voltage. Each curve has been normalized to their values at +200 mV. (B) G-V relations were determined as described in the text from the same data as used to generate the I-V plots in A. Smooth curves represent Boltzmann fits. Parameters of the fits are: mSloα V1/2 = 180 mV, z = 0.98, mSloα + β1 V1/2 = 200 mV, z = 0.61. (C) In each experiment, data was acquired at both 9.1 μM (squares) and 0.5 nM [Ca2+] (circles). G-V plots for both concentrations are shown in C. In A–C, error bars indicate SEM.
Figure 8
Figure 8
The [Ca2+] at which the voltage-dependent MWC model's V1/2 begins to shift is determined primarily by its affinity in the open conformation. (A) V1/2 vs. [Ca2+] plots calculated from with L(0) = 1,000, Q = 1.0, K C = 10 μM, and K O varying as indicated. (B) V1/2 vs. [Ca2+] plots determined from with L(0) = 1,000, Q = 1.0, K O = 1 μM, and K C varying as indicated. (C) V1/2 vs. [Ca2+] plots determined from with K O = 1 μM and K C = 10 μM, and L(0) or Q as above, or varying as indicated.
Figure 9
Figure 9
[Ca2+]critical changes very little with β1 coexpression. (A and B) Current traces recorded from macropatches in response to 400-ms ramps from −150 to +150 mV at the indicated [Ca2+] for mSloα (A) and mSloα + β1 (B). All traces in A are from the same patch, as are all traces in B. In E, current amplitude at +150 mV recorded with each [Ca2+] relative to that recorded at 9.1 μM are plotted as a function of [Ca2+]. Plots from 6 mSloα (•) and 11 mSloα + β1 (○) experiments are shown. (C and D) G-V relations determined as described with reference to Fig. 7 B for mSloα (C) and mSloα + β1 (D). [Ca2+] are as indicated. Each curve represents the average of between 2 and 11 experiments as indicated in Table . Each curve has been fitted with a Boltzmann function with the following parameters, in order of increasing [Ca2+]. mSloα V1/2 (mV) = 177, 176, 182, 174, 171, 110, 105, and 47; z = 0.90, 0.88, 0.93, 0.94, 0.93, 1.47, 1.57, and 1.28; mSloα + β1 V1/2 (mV) = 212, 211, 181, 197, 181, 71, 68, and −33; z = 0.62, 0.60, 0.61, 0.62, 0.55, 1.00, 1.00, and 0.98. In F are shown V1/2 vs. [Ca2+] plots for mSloα (•) and mSloα + β1 (○). Each point represents the mean of between 2 and 11 experiments, as indicated in Table . Error bars indicate SEM. Smooth curves represent fits to . For the fits, the Q parameter was constrained to the mean value from analysis of all of our 0.5 nM G-V data. Fit parameters were as follows: mSloα L(0) = 1,034, Q = 0.99, K O = 0.84 μM; mSloα + β1 L(0) = 141, Q = 0.64, K O = 0.68 μM.
Figure 10
Figure 10
(A) Scheme II, allosteric model of Horrigan et al. 1999. Horizontal transitions represent voltage sensor motion in each of four subunits with K VC and K VO representing the forward microscopic equilibrium constants for these transitions for the closed and open channel, respectively. Vertical transitions represent the conformation change by which the channel opens. All transitions are hypothesized to be voltage dependent. (B) Allosteric model to account for both the Ca2+- and voltage-dependent properties of mSlo gating. This model represents the simplest combination of Schemes I and II. Transitions along the long horizontal axis represent Ca2+ binding and unbinding. Transitions along the short horizontal axis represent voltage sensor movement. Transitions from top to bottom represent channel opening. Implicit in this scheme and are the assumptions that voltage sensors and Ca2+ binding sites in each subunit are identical and act independently, and that voltage-sensor movement does not directly influence Ca2+ binding, and vice versa.
Figure 11
Figure 11
Simulations that demonstrate that [Ca2+]critical for Scheme III, as for Scheme I, depend primarily on the affinity of the model channel when it is open. (A) 50-state-model V1/2 vs. [Ca2+] plots as a function of K O. A series of G-V relations were simulated with at [Ca2+] ranging from 0 to 1,000 μM. V1/2 for each curve was then plotted as a function of [Ca2+]. K O was varied as indicated and the simulations were repeated. (B) Simulated V1/2 vs. [Ca2+] plots were generated as in A, except K C rather than K O was varied. Except where indicated, model parameters were: L(0) = 5e5, Q = 0.40, K C = 10 μM, K O = 1 μM, Vh C = 135.9, D = 16.7, Z = 0.51.
Figure 12
Figure 12
50-state model analysis. (A) mSloα and (B) mSloα + β1 G-V relations over a series of [Ca2+] were fit with as described in the text. The resulting parameters are as indicated on the figure. Those values indicated in parentheses were not parameters of the fit, but rather calculated from the fit parameters. In A, the parameters other than those related to Ca2+ binding were constrained to be within the following ranges, which might reasonably fit the data of Horrigan et al. 1999 at subnanomolar [Ca2+] (Frank Horrigan, personal communication). L(0) 0.25–1 × 10⁶, Q 0.35–0.45, Vh c 135–155, D = 10–20, Z = 0.51–0.59. K 0 was constrained to be within 5% of the value estimated from [Ca2+]critical analysis 0.8–0.88 μM and K C was unconstrained. In B, K O was constrained to be within 5% of the value estimated from [Ca2+]critical analysis 0.65–0.72 μM, all other parameters were free to vary. In C–F, various parameters from the fit in B were restored to their values in A. In C, L(0) was restored. In D, the voltage-sensing parameters Q, Z, Vh c, and D were restored. In E, L(0), Q, Z, Vh c, and D were restored. In F, K O and K C were restored. In each panel, G-V relations at the following [Ca2+] are shown: from right to left, 0.0005, 0.99, 1.86, 4.63, 9.1, 39, and 74 μM. Error bars indicate SEM.

Similar articles

Cited by

References

    1. Adelman J.P., Shen K.Z., Kavanaugh M.P., Warren R.A., Wu Y.N., Lagrutta A., Bond C.T., North R.A. Calcium-activated potassium channels expressed from cloned complementary DNAs. Neuron. 1992;9:209–216. - PubMed
    1. Atkinson N.S., Robertson G.A., Ganetzky B. A component of calcium-activated potassium channels encoded by the Drosophila slo locus. Science. 1991;253:551–555. - PubMed
    1. Barrett J.N., Magleby K.L., Pallotta B.S. Properties of single calcium-activated potassium channels in cultured rat muscle. J. Physiol. 1982;331:211–230. - PMC - PubMed
    1. Bers D., Patton C., Nuccitelli R. A practical guide to the preparation of Ca buffers. Methods Cell Biol. 1994;40:3–29. - PubMed
    1. Brenner R., Jegla T.J., Wickenden A., Liu Y., Aldrich R.W. Cloning and functional characterization of novel potassium channel beta subunits, hKCNMB3 and hKCNMB4. J. Biol. Chem. 2000;275:6453–6461. - PubMed

Publication types

MeSH terms

Substances